A dashboard is supposed to answer questions quickly. Too many marketing dashboards do the opposite: forty charts, three colours of green and no clear sense of what to do on Monday morning. A good dashboard is less like a wall of numbers and more like a conversation with the business: how are we doing against goal, what changed, where is the problem and what should we try next? This guide explains what a marketing dashboard should contain, how to design it for different audiences, a layout that works, which charts to use, how to keep the data trustworthy and how to avoid the most common design mistakes.
Start with the purpose
A business dashboard is a visual summary of the measures that matter for a purpose and an audience. Three kinds are common in marketing, and they should not be mixed on one screen.
| Type | Audience | Question it answers | Refresh |
|---|---|---|---|
| Executive | Founders, leadership | Are we on track against goals? | Weekly or monthly |
| Channel or campaign | Channel owners | How is each channel or campaign performing, and what should we change? | Daily |
| Diagnostic | Analysts, managers | Why did the number move? | As needed |
Before you build anything, write down the audience and the decisions the dashboard should support. If you cannot name a decision, you do not need the chart.
A layout that works
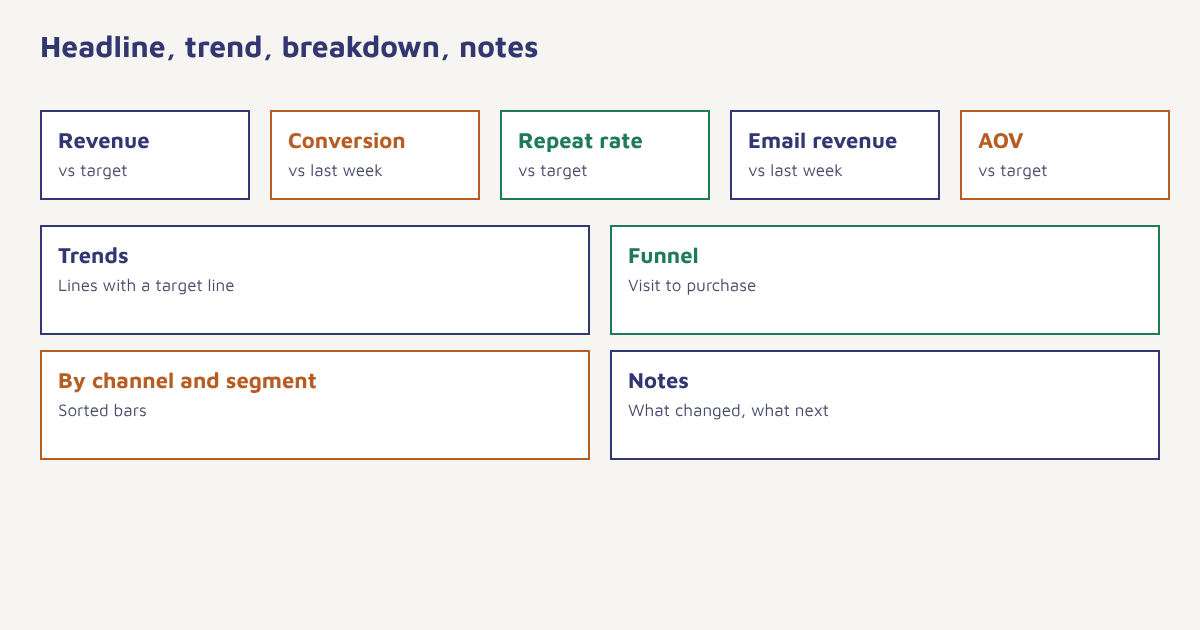
- Top row: three to six headline KPIs. Each with the current value, the target and the change from the previous period. See marketing KPIs.
- Second row: trends. Line charts over time for the main KPIs, with the target shown as a line.
- Third row: breakdowns. The same KPI split by channel, campaign, segment or product, so you can see where change comes from.
- Fourth row: funnel or journey. Where people drop off between steps. See marketing funnel stages.
- Notes panel. Two or three sentences on what changed, what you are doing about it and what you will test next.
What to put on it
| Section | Useful measures | More information |
|---|---|---|
| Acquisition | Visitors, leads, cost per lead, acquisition cost | Lead generation |
| Conversion | Conversion rate, checkout completion, average order value | CRO |
| Email and messaging | Delivery, click-through, unsubscribes, revenue per send | Email metrics |
| Retention | Retention rate, repeat purchase rate, churn | Cohort analysis |
| Revenue and value | Revenue, marketing ROI, lifetime value | Attribution |
| Health and sentiment | NPS, complaints, deliverability alerts | Sender reputation |
Choose charts that fit the question
| Question | Chart | Avoid |
|---|---|---|
| How is it changing over time? | Line chart | Many series on one chart |
| Which category is largest? | Sorted horizontal bars | Pie charts with many slices |
| How do steps convert? | Funnel or step bar chart | 3D effects |
| How do cohorts compare? | Heatmap or table with colour scale | Unlabelled colour |
| How is one number against target? | Large number with comparison and sparkline | Gauges that waste space |
| How are two measures related? | Scatter plot | Dual axes that mislead |
A few rules improve almost any chart: start bars at zero, label axes and units, keep colour meaning consistent across the dashboard, put the most important number in the largest type and show the comparison (target, previous period or last year) next to every headline value. Designers such as Edward Tufte have written about reducing needless decoration; the general idea is described under data-ink ratio.
Make the data trustworthy
- One definition per metric. Put a short description on hover or in a notes tab: formula, source and time window.
- One source of truth. If the email tool, the store and the analytics tool disagree, decide which is authoritative for each metric.
- Show data freshness. A visible “updated at” time prevents arguments about stale numbers.
- Handle small numbers. Show counts beside percentages, because 50 percent of two customers is not a trend.
- Mark known issues. If tracking broke on a date, annotate the chart.
- Respect privacy. Aggregate where possible and limit access to personal data. See the DPDP Act guide.
In Flowfox, analytics brings campaign, journey and channel results together, with cuts by segment from the segment builder. Because events and orders live on one profile in the data model, the numbers on the dashboard and the audiences you message are drawn from the same data. If you use a separate BI tool, the developer tools and FlowConnect describe how to move data out.
How to build your first dashboard
- Choose one audience. Write the three decisions they make with the numbers.
- List the KPIs. Three to six headline measures, each with an owner and target.
- Define each measure. Formula, source, window and refresh time.
- Sketch on paper. Place the headline row, trends and breakdowns before touching a tool.
- Build the minimum. Start with the headline row and two trends, then add only what people ask for.
- Test with real users. Ask someone to find an answer without help. Time them.
- Review every month. Remove charts nobody used and add what is missing.
A worked example
A home-décor store replaces its 30-chart report with a one-page dashboard for the weekly marketing meeting. The top row shows revenue, orders, conversion rate, repeat purchase rate and email revenue, each against target and last week. Below are line charts for revenue and conversion, a bar chart of revenue by channel and a small funnel from visit to purchase. A notes box at the bottom is filled in before the meeting by whoever owns the numbers: “Conversion dipped on mobile after the checkout change; testing a fix this week.” Meetings get shorter, because people read the numbers before arriving and spend the time deciding. The store and the layout are illustrative.
Tools and where the data should live
You can build a marketing dashboard in your platform’s reports, in a spreadsheet, in a business intelligence tool or in a custom page. The right choice depends on who needs the view and how much data you combine. Platform reports are quickest for campaign and channel results because the data is already there. A spreadsheet works for a small team that updates a handful of numbers weekly and values flexibility. A business intelligence tool becomes valuable when you must combine marketing with finance, inventory or support data, or when many people need filtered views. A custom page is rarely worth the effort unless you have unusual requirements.
Whatever you choose, treat the dashboard as the last step in a pipeline, not the first. Start by getting events and orders recorded consistently, since a dashboard cannot fix inconsistent data. Agree names for events, currencies and time zones, decide how to treat refunds and cancelled orders, and test a few numbers by hand against the source. A useful habit is a monthly reconciliation: pick three headline numbers and check them against the finance system or the store admin. Small differences are normal, for example because of timing or attribution rules, but you should be able to explain them. The broader field is often called business intelligence, and its basic lesson applies here too: trust comes from consistent definitions more than from clever charts.
Think about access and sharing. Decide who can see revenue and who can see personal data, and prefer aggregated views for wide audiences. If you send a weekly snapshot by email, include the key numbers in the message itself, not only a link, since many people will read it on a phone. In Flowfox, you can also use a scheduled campaign to send an internal summary to your team. Finally, agree an owner for the dashboard itself. Someone should be responsible for fixing broken charts, answering questions about definitions and removing clutter, or it will slowly decay into the wall of numbers it was meant to replace.
Common mistakes
- Building for everyone. A dashboard for all audiences serves none.
- Too many charts. Each extra chart dilutes attention.
- No targets or comparisons. A number alone has no meaning.
- Vanity metrics on top. Put outcomes first. See leading and lagging indicators.
- Never updating. Goals change, so dashboards should too.
- No story. Add a few words on what the numbers mean.
A dashboard is not finished when everything is on it. It is finished when nothing can be taken off.
See every channel in one view. Review campaigns, journeys and segments, and cut results the way you plan.
Read next: A/B test sample size, growth rate formula and the blog.
Frequently asked questions
What is a marketing dashboard?
A marketing dashboard is a visual summary of the key measures of marketing performance, designed for a specific audience and set of decisions.
What should a marketing dashboard include?
Headline KPIs with targets and period comparisons, trend charts, breakdowns by channel or segment, a funnel view and a short notes section explaining changes.
How many metrics should a dashboard have?
Three to six headline measures, with a small number of supporting charts. More than that makes it hard to see what matters.
How often should a marketing dashboard be updated?
Executive views are often weekly or monthly, channel dashboards daily and diagnostic views as needed. Always show when the data was last updated.
What is the best chart for tracking a KPI over time?
A line chart, with the target shown as a reference line, is usually the clearest way to show change over time.
How do I make sure dashboard numbers are accurate?
Define each metric once, choose a source of truth, show data freshness, annotate tracking issues and compare against another source periodically.
Should I use a BI tool or my marketing platform for dashboards?
Use your marketing platform for operational campaign and channel reports, and a BI tool when you need to combine marketing with finance or other business data.