Growth is the number every business is asked about: how fast are we growing, and is it getting better or worse? The answer is a growth rate, a simple percentage that compares a value now with the same value earlier. This guide gives the growth rate formula, worked examples for revenue, customers and subscribers, explains month-over-month, year-over-year and compound growth, shows how to calculate growth in a spreadsheet and warns about the traps that make growth figures misleading.
What is a growth rate?
A growth rate expresses the change in a quantity over a period as a percentage of its starting value. It works for sales, active users, email subscribers, orders, revenue per customer or anything else you can count. Because it is a ratio, it lets you compare things of different size: a store adding 500 customers to a base of 1,000 is growing much faster than a store adding 500 to a base of 50,000. The idea is the same one used in economics for economic growth and in finance for investment returns.
The growth rate formula
Formula. Growth rate (%) = ((Current value − Previous value) ÷ Previous value) × 100
A positive result means growth, a negative one means decline. The previous value is always the denominator, which is the most common place for mistakes.
| Example | Previous | Current | Calculation | Growth rate |
|---|---|---|---|---|
| Monthly revenue | ₹8,00,000 | ₹9,20,000 | (1,20,000 ÷ 8,00,000) × 100 | 15% |
| Active customers | 4,200 | 4,998 | (798 ÷ 4,200) × 100 | 19% |
| Email subscribers | 12,000 | 11,400 | (−600 ÷ 12,000) × 100 | −5% |
| Orders per week | 350 | 350 | 0 ÷ 350 | 0% |
The numbers are invented to show the method. Swap in your own.
Types of growth rate
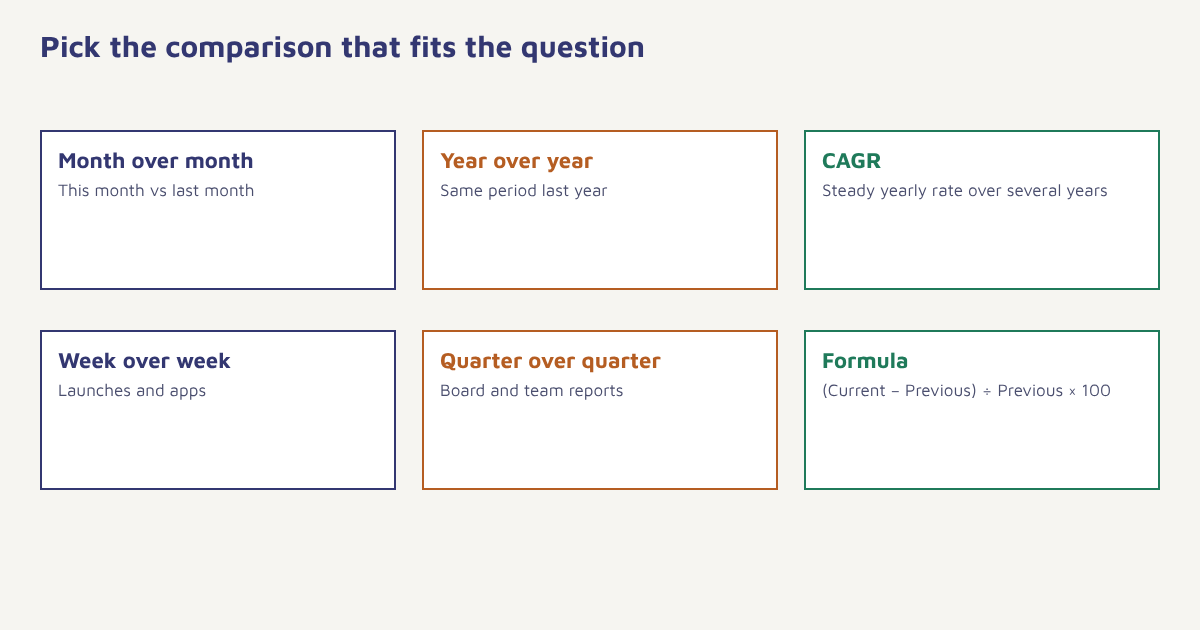
| Type | Compares | Best for | Watch out for |
|---|---|---|---|
| Month over month (MoM) | This month with last month | Young, fast-moving businesses | Seasonality and short months distort it |
| Quarter over quarter (QoQ) | This quarter with the last | Reporting to a team or board | Festival quarters look stronger |
| Year over year (YoY) | This month or year with the same period last year | Seasonal businesses | Hides recent changes |
| Compound growth (CAGR) | Start and end over several years, smoothed | Long-term trends | Hides ups and downs in between |
| Week over week (WoW) | This week with last week | Campaign launches, apps | Noise from small numbers |
Compound growth rate
When you want the average yearly growth over several years, use the compound annual growth rate. It answers: what steady yearly rate would take me from the start value to the end value?
CAGR formula. CAGR = ((Ending value ÷ Starting value) ^ (1 ÷ Number of years)) − 1
If revenue grows from ₹50 lakh to ₹80 lakh over three years, the ratio is 1.6. The cube root of 1.6 is about 1.17, so the CAGR is about 17 percent a year. Individual years may have been higher or lower, but 17 percent is the steady rate that produces the same result.
# Spreadsheet formulas
Growth rate:   =(B3-B2)/B2
As percent:    =(B3-B2)/B2   (format cell as %)
CAGR:          =(B_end/B_start)^(1/years)-1
Month average: =AVERAGE(C3:C14)
Growth rates a marketing team should track
| Metric | Why it matters | Related guide |
|---|---|---|
| Subscriber growth | Net new contacts after unsubscribes and bounces | Email list building |
| Customer growth | New minus lost customers | Retention rate |
| Revenue growth | Overall health and pricing | Customer lifetime value |
| Engagement growth | Opens, clicks, active users | Email marketing metrics |
| Channel growth | Which channel adds the most | Email vs SMS vs WhatsApp |
Look at growth together with cost. A channel that doubles each month but costs ever more per customer may not be healthy. Combine growth with customer acquisition cost and retention, so that you know whether growth is efficient and lasting.
In Flowfox, analytics lets you compare periods for subscribers, sends, conversions and revenue by channel, and the event data behind it makes it easy to cut growth by segment or acquisition source.
How to calculate and use a growth rate
- Choose the metric. One clear measure, such as paying customers or monthly revenue.
- Choose the period. Month, quarter or year, and keep it the same each time.
- Get the two values. The current value and the value from the earlier period.
- Apply the formula. Subtract, divide by the earlier value and multiply by 100.
- Compare with the right baseline. Last year’s same period for seasonal sales, last month for newer products.
- Ask why. Check which segment, channel or product drove the change.
A worked example from start to finish
Imagine an online store that tracks monthly revenue. January brings in ₹10,00,000, February ₹10,80,000 and March ₹11,34,000. The month-over-month growth for February is 8 percent and for March it is 5 percent. A quick glance suggests growth is slowing. But a year-over-year view tells another story: March last year was ₹8,50,000, so March this year is up by about 33 percent. The slowdown from February to March is just the normal pattern after a promotional peak, and the year-over-year figure shows that the underlying business is healthy. This is why it helps to look at two views side by side.
Next, break the number down. If new customers contributed most of the March growth while repeat customers stayed flat, the business is buying growth through acquisition and may be getting weaker at keeping people. If instead repeat purchases rose, the base is deepening. Splitting growth by new and returning customers, by channel and by product category usually reveals more than the headline rate does. You can also express growth in a funnel: visits, sign-ups, first orders and repeat orders each have their own rate, and the weakest link tells you where to work first. For a closer look at the economic idea behind these ratios, the article on percentage change is a useful reference, and our guide to cohort analysis shows how to follow groups of customers over time.
Finally, set targets sensibly. A target such as “grow 10 percent a month” compounds quickly: it means roughly tripling in a year, which few businesses can sustain. State targets as absolute numbers as well as percentages, and tie them to the actions you will take, such as launching a new channel or running a retention programme. Review the numbers on a schedule and write down what changed, so that growth becomes something you understand and can repeat, not a figure you simply report. When a number looks surprisingly good or bad, check the data source and the period boundaries first, because a missed day or a double-counted order is a more common cause than a real change.
Traps that make growth misleading
- Small bases. Going from 10 to 30 customers is 200 percent growth, but it says little.
- Seasonality. Comparing a festival month with a quiet one inflates the rate. Use year over year.
- Dividing by the wrong value. Always divide by the earlier value.
- Averaging percentages. Growth rates compound, so do not simply add or average them. Use CAGR.
- Ignoring declines. A 50 percent fall needs a 100 percent rise to recover.
- Vanity metrics. Growth in sign-ups means little if activation and retention are weak.
A growth rate tells you how fast. It never tells you whether you are going somewhere worth going.
Watch growth by channel and segment. Compare periods and see which campaigns add customers and revenue.
Read next: customer retention rate, conversion rate optimization and the blog.
Frequently asked questions
What is the growth rate formula?
Growth rate = ((current value minus previous value) divided by previous value) times 100.
How do you calculate month-over-month growth?
Subtract last month’s value from this month’s, divide by last month’s value and multiply by 100.
What is the difference between YoY and MoM growth?
Month over month compares with the previous month, which suits fast-moving businesses. Year over year compares with the same period last year, which removes seasonality.
How do I calculate CAGR?
Divide the ending value by the starting value, raise the result to the power of one divided by the number of years, and subtract one.
Can a growth rate be negative?
Yes. A negative growth rate means the value fell compared with the earlier period.
Why is growth from a small base misleading?
Small starting numbers produce large percentages from tiny absolute changes, so always show the actual numbers next to the percentage.
What growth rates should an email marketer track?
Net subscriber growth, engagement growth, revenue per send and growth by channel, along with unsubscribe and complaint rates.