Open rate, click rate, unsubscribe rate, conversion rate, revenue per email: email reports are full of numbers, and some of them are quietly misleading. The skill is knowing which metric answers which question, how each is calculated and what a sensible benchmark looks like. This guide walks through the main email marketing metrics, with formulas and a worked example, explains why open rate has become unreliable, and shows how to build a short report that supports real decisions.
The email metrics funnel
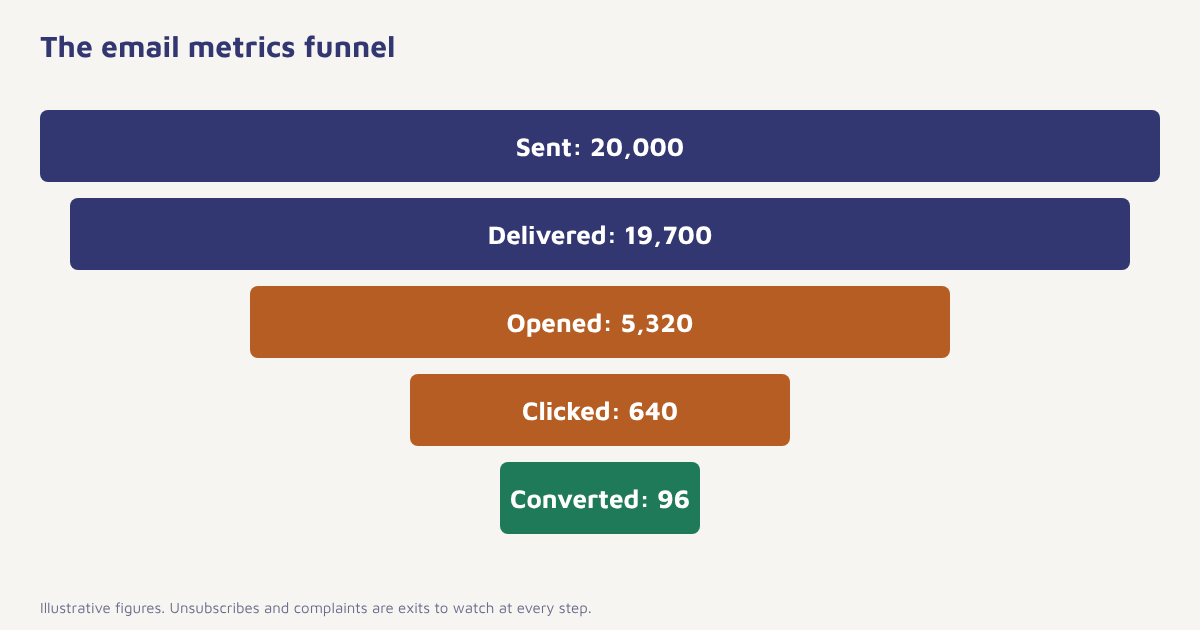
Think of a campaign as a funnel. Every email is sent, most are delivered, some are opened, a smaller share are clicked and a few lead to a purchase or sign-up. Each ratio tells you something different about a different part of the job: the list, the subject line, the content and the offer. Our email marketing guide covers the craft, and this page covers the measurement.
The main metrics and formulas
| Metric | Formula | What it tells you |
|---|---|---|
| Delivery rate | Delivered ÷ sent × 100 | List quality and reputation |
| Bounce rate | Bounced ÷ sent × 100 | Bad addresses. See email bounce rate |
| Open rate | Unique opens ÷ delivered × 100 | Subject line and sender appeal, with caveats |
| Click-through rate (CTR) | Unique clicks ÷ delivered × 100 | Content and call to action |
| Click-to-open rate (CTOR) | Unique clicks ÷ unique opens × 100 | Quality of content for those who opened |
| Conversion rate | Conversions ÷ delivered (or clicks) × 100 | Whether the offer and landing page work |
| Unsubscribe rate | Unsubscribes ÷ delivered × 100 | Relevance and frequency |
| Complaint rate | Spam complaints ÷ delivered × 100 | Trust and permission quality |
| Revenue per email | Revenue from the campaign ÷ delivered | Commercial value |
| List growth rate | (New − lost subscribers) ÷ list size × 100 | Health of the list |
A worked example
You send a campaign to 20,000 contacts. 19,700 are delivered, 300 bounce. There are 5,320 unique opens, 640 unique clicks, 96 orders and 28 unsubscribes. The sums are straightforward.
| Metric | Calculation | Result |
|---|---|---|
| Bounce rate | 300 ÷ 20,000 | 1.5% |
| Delivery rate | 19,700 ÷ 20,000 | 98.5% |
| Open rate | 5,320 ÷ 19,700 | 27.0% |
| CTR | 640 ÷ 19,700 | 3.2% |
| CTOR | 640 ÷ 5,320 | 12.0% |
| Conversion rate (of delivered) | 96 ÷ 19,700 | 0.49% |
| Conversion rate (of clickers) | 96 ÷ 640 | 15.0% |
| Unsubscribe rate | 28 ÷ 19,700 | 0.14% |
These figures are an illustration, not a benchmark. Notice how the same 96 orders look like 0.49 percent or 15 percent depending on the denominator. Always state which one you use, and keep it the same from report to report.
Why open rate is less reliable now
Open tracking relies on a tiny hidden image loaded when the message is displayed, a technique described in the article on email tracking. Since Apple introduced Mail Privacy Protection in 2021, Apple Mail can fetch that image for the user automatically, recording an open even when nobody looked at the message. Some other apps and security scanners also load images in advance. The result is inflated and noisy open rates. They are still useful for comparing two subject lines sent at the same time to similar groups, but they are weak as an absolute measure of interest. For decisions, lean on clicks, replies and conversions, which need a real action. Our guide to A/B testing explains how to compare fairly, and the subject line guide covers the creative side.
Rule of thumb. Use opens to compare, clicks to judge content, conversions to judge the offer and revenue to judge the programme.
What are good benchmarks?
Benchmarks vary widely by industry, list quality, audience and the type of email, and published averages come from different samples and methods. A welcome email will usually outperform a promotion, and a transactional message will outperform both. Use outside figures only as a rough sanity check. The most useful comparison is your own history: this month against last month, this campaign against similar ones and a segment against the whole list. If you want industry figures, check the latest reports from your email platform or industry bodies, and note how they define each metric.
How to build a simple, useful email report
- Start with the goal. Is the campaign meant to sell, to inform or to re-engage? Choose the headline metric accordingly.
- Pick five numbers. Delivery, click rate, conversion rate, unsubscribe rate and revenue per email are enough for most teams.
- Compare with a baseline. Use your own average for the same type of email.
- Segment the results. Break down by audience, device, mailbox provider and source. See customer segmentation.
- Look at the trend. A rolling 90-day view smooths out one-off swings.
- Write the takeaway. One sentence: what we learned and what we will change.
- Act and record. Run the next test and keep a log of results.
Connecting email to revenue
Clicks are not sales. To attribute revenue, you need to connect email activity with order events. Flowfox stores both on the same profile, so you can see which messages a customer received before buying, using the data model and the reports in analytics. Attribution always involves choices: a last-click view gives credit to the final email, while a holdout test, where a small random group does not receive the campaign, shows the true lift. For automated flows such as abandoned cart emails or a welcome drip, a holdout group is the most honest way to measure what the programme adds.
-- Email campaign summary: one row per campaign
SELECT campaign_id,
       COUNT(*)                                             AS sent,
       SUM(delivered)                                       AS delivered,
       ROUND(100 * SUM(clicked) / NULLIF(SUM(delivered),0), 2) AS ctr_pct,
       ROUND(100 * SUM(unsubscribed) / NULLIF(SUM(delivered),0), 3) AS unsub_pct,
       SUM(order_value)                                     AS revenue,
       ROUND(SUM(order_value) / NULLIF(SUM(delivered),0), 2) AS revenue_per_email
FROM email_events
GROUP BY campaign_id;
What to do when a metric looks wrong
| Symptom | Likely cause | Try |
|---|---|---|
| Low delivery | Bounces or blocks | Clean the list, check authentication |
| Low opens, normal clicks | Subject line, sender name or privacy noise | Test subject lines, judge by clicks |
| Good opens, few clicks | Content or call to action | Simplify the email, one clear button |
| Good clicks, few conversions | Landing page or offer mismatch | Check page speed, message match, price |
| Rising unsubscribes | Too frequent or irrelevant | Segment, reduce frequency, offer preferences |
| Rising complaints | Permission or expectation problem | Review sign-up flow and sender identity |
Metrics that protect your sender reputation
Some numbers matter more than their size suggests because mailbox providers read them too. A complaint rate that creeps towards a few tenths of a percent, or a hard bounce rate above a percent or two, can lead providers to send your mail to spam, which then lowers every other metric in this guide. Treat these as guardrails, check them after every send and pause a campaign if they move. Review the broader mechanics in the article on email deliverability and the way email marketing programmes are usually measured. Keep your own definitions written down: whether a click counts once or every time, whether you count delivered or sent in the denominator, and how long after sending you keep counting. The most common reason two reports disagree is that two people calculated the same metric in two ways.
Common mistakes
- Treating opens as the truth. They are the weakest signal now.
- Switching denominators. Compare like with like.
- Chasing benchmarks. Your own trend matters more.
- Reporting too many numbers. A dozen metrics hide the message.
- Ignoring unsubscribes and complaints. They are early warnings.
Measure what changes a decision. Everything else is decoration.
See every email metric in one place. Track delivery, clicks, conversions and revenue by campaign and segment.
Read on: cohort analysis and customer lifetime value, or browse the blog.
Frequently asked questions
What are the most important email marketing metrics?
Delivery rate, click-through rate, conversion rate, unsubscribe rate, complaint rate and revenue per email give the clearest picture. Open rate is useful mainly for comparing subject lines.
How do you calculate email open rate?
Divide unique opens by delivered emails and multiply by 100. Because privacy features can trigger false opens, treat the figure as a rough indicator.
What is the difference between click-through rate and click-to-open rate?
Click-through rate divides unique clicks by delivered emails. Click-to-open rate divides unique clicks by unique opens, so it shows how engaging the content was for those who opened.
Why is my open rate so high?
Mail privacy features, such as Apple Mail Privacy Protection, can load tracking images automatically and record opens that did not involve a person reading the message.
What is a good email click-through rate?
It depends on industry, list and email type. Compare against your own history and similar campaigns rather than a single published average.
How do I measure email revenue?
Connect email events with order events, then use last-click attribution for a quick view and a holdout group to measure the true lift of a campaign or automation.
How often should I review email metrics?
Check bounces, complaints and unsubscribes after every send, review campaign performance weekly and look at 90-day trends monthly.