Revenue tells you what happened last quarter. By the time it drops, it is too late to prevent the cause. Good teams watch a second kind of number as well, one that moves earlier and hints at what is coming. That is the difference between lagging and leading indicators. This guide defines both, gives clear examples for marketing, sales, product and customer success, shows how to pair them, explains how to choose the right ones and warns about common mistakes such as measuring what is easy rather than what predicts.
Lagging and leading indicators defined
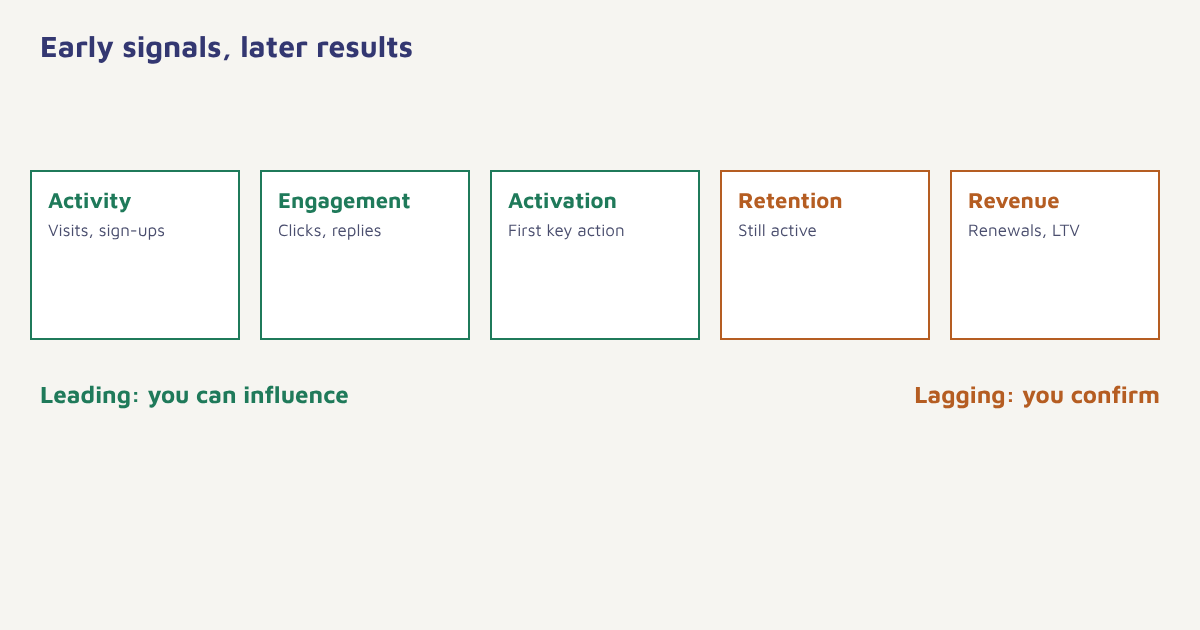
A lagging indicator measures an outcome after it has happened, such as revenue, profit, churn or customer count. It is accurate but late. A leading indicator measures something that tends to come before the outcome and can be influenced, such as demo requests, activation rate or the number of qualified leads. It is less certain but gives you time to act. The two terms are common in economic indicators and in the performance frameworks described under key performance indicators.
Side-by-side comparison
| Leading indicator | Lagging indicator | |
|---|---|---|
| Timing | Before the result | After the result |
| Purpose | Predict and steer | Confirm and report |
| Control | Can be influenced directly | Hard to change quickly |
| Accuracy | Less certain | More certain |
| Example | Trial sign-ups, replies, activation | Revenue, churn, profit |
| Risk if used alone | False signals | Reacting too late |
Examples by team
| Team | Leading indicators | Lagging indicators |
|---|---|---|
| Marketing | Website visits, sign-ups, email click rate, qualified leads | Customer acquisition cost, revenue from marketing, pipeline value |
| Sales | Meetings booked, proposals sent, follow-ups made | Deals won, revenue, win rate |
| Product | Activation rate, feature adoption, weekly active use | Retention, expansion revenue, churn |
| Customer success | Login frequency, support tickets, survey score trends | Renewal rate, customer lifetime value |
| Ecommerce | Add-to-cart rate, repeat visits, wishlist adds | Orders, average order value, repeat purchase rate |
| Email programme | Click rate, replies, list growth | Revenue per email, unsubscribe trend over months |
Many metrics can be either, depending on what you are trying to predict. Email clicks lead to purchases but lag behind sends. The test is simple: ask what outcome you care about, then ask which earlier signal, which you can influence, tends to precede it. See our guides to email marketing metrics, customer retention rate and customer lifetime value for common lagging measures.
Link each lagging outcome to its leading signals
Take a lagging goal and work backwards. Suppose the goal is to raise yearly renewals for a software product. Renewal is the lagging result. Customers who renew tend to have used three key features in their first month, logged in weekly, invited teammates and rated support highly. Each of these is a leading indicator you can track from week one and improve through onboarding, in-app guidance and timely messages. If you notice that accounts with fewer than two weekly logins in month two rarely renew, you can create a segment of those accounts and send help before the renewal date.
- State the outcome. One lagging number, such as renewal rate or revenue per customer.
- List what usually happens before it. Use data, customer interviews and team experience.
- Test the link. Compare outcomes for customers with and without the early behaviour. See cohort analysis.
- Choose three to five leading indicators. They must be measurable, timely and actionable.
- Set thresholds and alerts. For example, flag accounts with no login for 14 days.
- Act on them. Attach a message or task to each warning. See behavioral segmentation.
- Review and refine. Drop indicators that stop predicting.
In Flowfox, event data on the profile lets you build segments from leading signals in the segment builder, trigger a journey when they appear and watch the lagging results in analytics. Our churn use case shows a complete example.
How to choose good indicators
| Test | Question |
|---|---|
| Predictive | Does it really move before the outcome? |
| Actionable | Can the team change it? |
| Measurable | Can you capture it reliably and soon? |
| Understood | Can everyone explain why it matters? |
| Limited | Are there few enough to focus on? |
| Not gameable | Can people hit it without helping the business? |
That last point matters. Goodhart’s law warns that when a measure becomes a target, it stops being a good measure. If a sales team is rewarded for calls made, calls will rise whether or not deals follow. Pair a leading indicator with a quality check, such as calls that lead to meetings, so that people cannot hit the number while missing the point.
Putting them on one dashboard
A useful report shows both kinds together: a few leading indicators on the left, trended weekly, and the lagging outcomes on the right, trended monthly. Mark the expected lag, for instance “activation this week predicts retention in 60 days”. When a leading number moves, the team discusses what to do now. When a lagging number moves, the team asks which leading indicators had warned them, which keeps the model honest. Review the pairing every quarter, because customer behaviour and products change, and yesterday’s predictor may no longer predict.
A worked example: an online course business
A course platform cares about one lagging number above all: the share of students who finish a course and buy a second one. Looking back at data, the team finds that students who watch the first two lessons within three days, join the community channel and complete the first quiz are far more likely to finish. Those three behaviours become the leading indicators. Each week the team checks what share of new students hit all three by day seven. When the number slips, they do not wait for completion rates to fall months later. Instead they test a sharper welcome message, a reminder on WhatsApp after day two and a short nudge inside the app. Over a few cohorts they can see whether the leading numbers improve and whether completions follow with a lag.
The same logic applies elsewhere. A subscription box business may watch skipped shipments and support contacts as early signs of cancellation. A bank may watch the first transactions on a new card. A B2B tool may watch how many teammates an account invites in the first fortnight. In each case, the value of the leading indicator is only as good as the evidence that it predicts, so revisit the link on fresh data at least twice a year. The figures and business here are illustrative, but the method is general. For a clear overview of related ideas, see the article on balanced scorecard, which pairs outcome measures with the drivers behind them, and our guide to cohort analysis for how to compare groups fairly.
One more practice helps: write down the expected time lag. If activation this week should show up in retention in about two months, then a drop in activation is a call to act now, not a surprise to explain later. Teams that record these expectations learn faster, because they can see which of their beliefs about the business were right and which were not.
Common mistakes
- Only lagging metrics. You find out too late.
- Only leading metrics. You may optimise numbers that do not pay.
- Too many indicators. Focus beats coverage.
- Assuming a link without testing. Check the data.
- Not acting. An indicator no one responds to is decoration.
Lagging indicators are the scoreboard. Leading indicators are the plays you can still call.
Spot trouble before it shows up in revenue. Trigger journeys from early signals and track the results.
Read next: growth rate formula, customer engagement and the blog.
Frequently asked questions
What is the difference between leading and lagging indicators?
Leading indicators move before an outcome and can be influenced, such as demo requests. Lagging indicators measure the outcome after it happens, such as revenue or churn.
What are examples of leading indicators in marketing?
Website visits, sign-ups, email click rate, qualified leads, and engagement with content are common leading indicators in marketing.
What are examples of lagging indicators?
Revenue, profit, customer churn, customer acquisition cost, renewal rate and customer lifetime value are common lagging indicators.
Is a KPI a leading or lagging indicator?
A KPI can be either. Many teams use a mix, with leading KPIs to steer day to day and lagging KPIs to confirm results.
How many leading indicators should I track?
Three to five per outcome is usually enough. More dilutes focus and makes it harder to act.
How do I know if a leading indicator really predicts the outcome?
Compare outcomes for customers who showed the behaviour with those who did not, for example using cohort analysis, and recheck regularly.
Can a metric be both leading and lagging?
Yes, depending on what you are predicting. Email clicks lag behind sends but lead purchases.