
Your overall retention number can look steady while your newest customers quietly leave faster than your old ones. Averages hide that. Cohort analysis does not. It groups customers by when they started, then follows each group over time, so you can see whether a change you made last month actually helped. It is one of the most useful and least intimidating techniques in marketing analytics, and you can start with a spreadsheet. This guide explains what a cohort is, how to read a retention table, how to build one with a worked example, the types of cohort worth tracking and the mistakes to avoid.
What is cohort analysis?
A cohort is a group of people who share a starting point in time or a characteristic. In marketing, the most common cohort is everyone who signed up or made their first purchase in the same week or month. Cohort analysis compares how those groups behave in the periods that follow, for example how many are still active one, two or three months later. Unlike a single overall figure, it separates the effect of age from the effect of change, which lets you answer questions such as: are customers acquired after our onboarding redesign staying longer than those before it?
Why averages mislead
Imagine a business with 10,000 customers and a monthly retention of 80 percent. It sounds stable. But if the 6,000 customers who joined in the last two months retain at 60 percent and the 4,000 older customers retain at 105 percent of their starting spend, the picture is very different, and the future depends on the new group. Blended figures such as churn rate are useful, but cohorts show you where the number comes from. They also give a fair comparison: month three of one cohort against month three of another, rather than a young group against an old one.
How to read a retention table
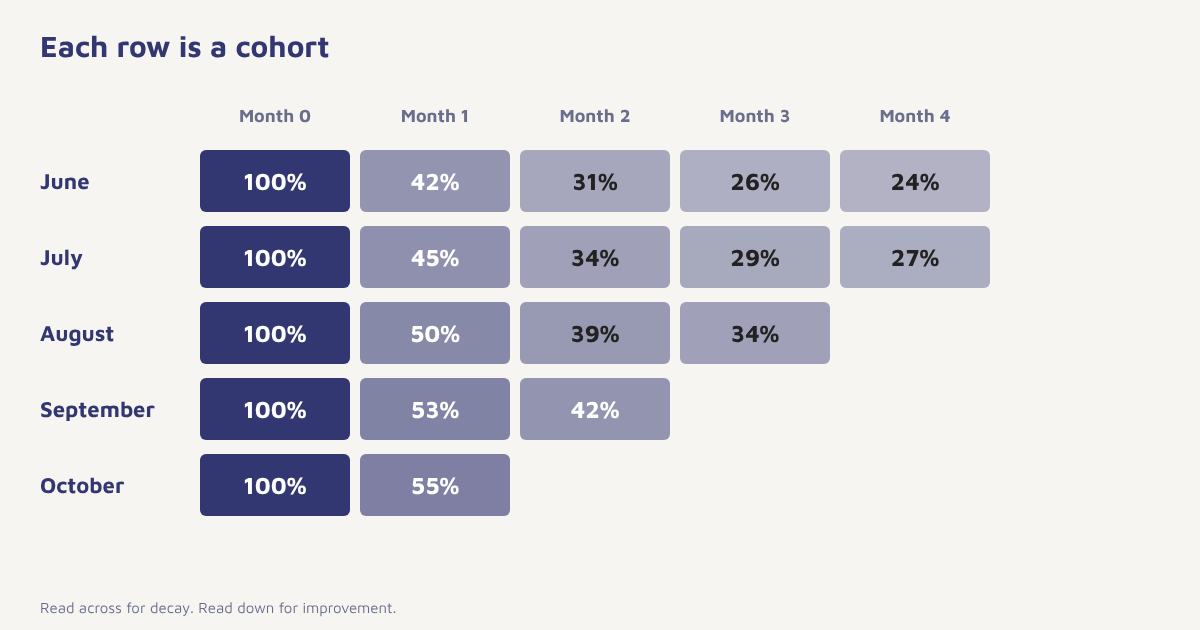
| Signup month | Customers | Month 0 | Month 1 | Month 2 | Month 3 | Month 4 |
|---|---|---|---|---|---|---|
| June | 1,000 | 100% | 42% | 31% | 26% | 24% |
| July | 1,200 | 100% | 45% | 34% | 29% | 27% |
| August | 1,100 | 100% | 50% | 39% | 34% | |
| September | 1,400 | 100% | 53% | 42% | ||
| October | 1,300 | 100% | 55% |
These numbers are an illustration. Read across a row to see how one group fades over time. Read down a column to compare cohorts at the same age: month 1 retention rose from 42 percent to 55 percent between June and October, which suggests something improved. The triangle shape appears because newer cohorts have not had time to reach later months. Look for three things: how steeply the first month drops, where the curve flattens, and whether newer rows are better or worse than older ones.
How to build a cohort analysis
- Define the starting event. First purchase, signup, first app open or trial start. Pick the one that matches your business.
- Define the return event. What counts as active: a purchase, a login, an opened feature. Be specific.
- Choose the cohort size. Weekly for fast products, monthly for most, quarterly for slow ones.
- Assign every customer to a cohort. Use the date of the starting event.
- Count activity by period since start. For each cohort, count customers active in month 0, 1, 2 and so on.
- Divide by cohort size. Retention in each cell equals active customers divided by the number who started.
- Visualise and compare. Use a heat map and compare rows at the same age.
- Ask why. When a cohort stands out, look at what changed that month: a campaign, a product launch or a pricing change.
Formula. Retention in month n = customers from the cohort active in month n ÷ customers in the cohort × 100
Types of cohorts worth tracking
| Cohort type | Grouped by | Question it answers |
|---|---|---|
| Acquisition cohort | Signup or first purchase date | Is retention improving over time? |
| Channel cohort | Source such as email, ads, referral | Which channels bring customers who stay? |
| Behavioural cohort | An early action, such as using a key feature in week one | Which actions predict retention? |
| Campaign cohort | Customers who received a campaign | Did the campaign cause a lasting change? |
| Plan or product cohort | First product or plan | Do some entry points retain better? |
| Value cohort | First order size or RFM group | Do high spenders last longer? |
Behavioural cohorts are especially powerful. If customers who complete setup in the first three days retain at twice the rate, that is a strong hint to redesign your onboarding around that step. Value-based cohorts link nicely with RFM analysis and customer lifetime value, and channel cohorts help you decide where to put acquisition budget.
What to measure inside cohorts
- Customer retention. The share still active in each period.
- Revenue retention. Revenue from the cohort relative to its first month, which can exceed 100 percent if customers expand.
- Repeat purchase rate. Share who place a second, third order.
- Time to second purchase. A leading signal for retention in commerce.
- Cumulative revenue per customer. A cohort-based view of value.
Cohorts in Flowfox
Events and attributes sit on one profile in the data model, so you can define a starting event and a return event without exporting data. The analytics section shows retention by cohort, and the segment builder lets you create a cohort as a live audience, for instance “signed up in October and has not completed setup”, then send it a journey. That closes the loop between insight and action. The retention use case and churn use case show practical patterns, and our retention strategies guide covers what to do with the findings.
-- Monthly signup cohorts and month-by-month retention
WITH cohorts AS (
  SELECT customer_id, DATE_FORMAT(MIN(created_at), '%Y-%m-01') AS cohort_month
  FROM orders GROUP BY customer_id
),
activity AS (
  SELECT DISTINCT customer_id, DATE_FORMAT(created_at, '%Y-%m-01') AS active_month
  FROM orders
)
SELECT c.cohort_month,
       TIMESTAMPDIFF(MONTH, c.cohort_month, a.active_month) AS months_since,
       COUNT(DISTINCT a.customer_id) AS active_customers
FROM cohorts c JOIN activity a USING (customer_id)
GROUP BY c.cohort_month, months_since
ORDER BY c.cohort_month, months_since;
If you use a data warehouse or a spreadsheet, a query like this produces the raw counts, and a pivot table turns it into the retention grid.
Turning findings into action
| What you see | What it might mean | What to try |
|---|---|---|
| Big drop in month 1 | Weak first experience | Improve onboarding, send a welcome drip. See drip campaigns |
| Curve never flattens | No habit forming | Add reasons to return: content, reminders, loyalty |
| Newer cohorts worse | Acquisition quality or product change | Review channels and recent changes |
| One cohort much better | A campaign or change worked | Find the cause and repeat it |
| Revenue retention above 100% | Expansion or repeat purchases | Invest in cross-sell |
Be careful about claiming cause. A better cohort may reflect a seasonal effect or a different audience rather than the change you made, so use a holdout group or an A/B test when you can, as described in our A/B testing guide. Keep cohorts large enough to be meaningful, since a cohort of 40 people will swing wildly month to month.
Common mistakes
- Vague definitions. If “active” changes between reports, comparisons break.
- Tiny cohorts. Small groups produce noise.
- Comparing different ages. Compare month 3 to month 3.
- Ignoring seasonality. A festival-month cohort behaves differently.
- Stopping at the chart. The value is in the next action.
An average tells you how the business is. A cohort tells you where it is going.
See retention by cohort. Define starting and return events, view retention, and message the cohorts that need help.
For further reading, see customer churn rate and customer segmentation, and visit the blog.
Frequently asked questions
What is cohort analysis?
Cohort analysis groups customers by a shared starting point, usually signup or first purchase date, and tracks how each group behaves over time, for example how many remain active each month.
What is a cohort in marketing?
A cohort is a group of customers who share a characteristic, most often the period in which they signed up or first bought.
How do you calculate cohort retention?
Divide the number of customers from a cohort who are active in a given period by the number who started in the cohort, then multiply by 100.
What is the difference between cohort analysis and segmentation?
Segmentation groups customers by attributes or behaviour at a point in time. Cohort analysis groups by when they started and follows them over time. The two work well together.
How big should a cohort be?
Large enough to avoid random swings. A few hundred customers per cohort is a useful guide, so use quarterly cohorts for small businesses.
Which cohort period should I use?
Weekly for fast-moving products, monthly for most businesses and quarterly for slow buying cycles or small customer counts.
Can I do cohort analysis in a spreadsheet?
Yes. Export customer IDs, start dates and activity dates, assign cohorts, count activity by period and use a pivot table to build the retention grid.