Customer churn rate is the share of customers you lose over a period. It is one of the few numbers that tells you, in a single line, whether the business is a bucket with a hole in it. This guide gives you the formula, the variants you will meet (customer, revenue, gross and net), a worked example with real arithmetic, rough benchmarks, the reasons people leave, and a practical plan for bringing the number down.
What is customer churn rate?
Churn rate measures how many customers stop buying from you or cancel a subscription during a given time. Teams that sell subscriptions track it monthly. Retailers and marketplaces, where there is no cancellation button, usually define a churned customer as someone who has not purchased within a set window, such as 180 days. The opposite measure is customer retention: if 4 percent of customers churn, 96 percent are retained.
Customer churn rate formula
The basic formula is simple.
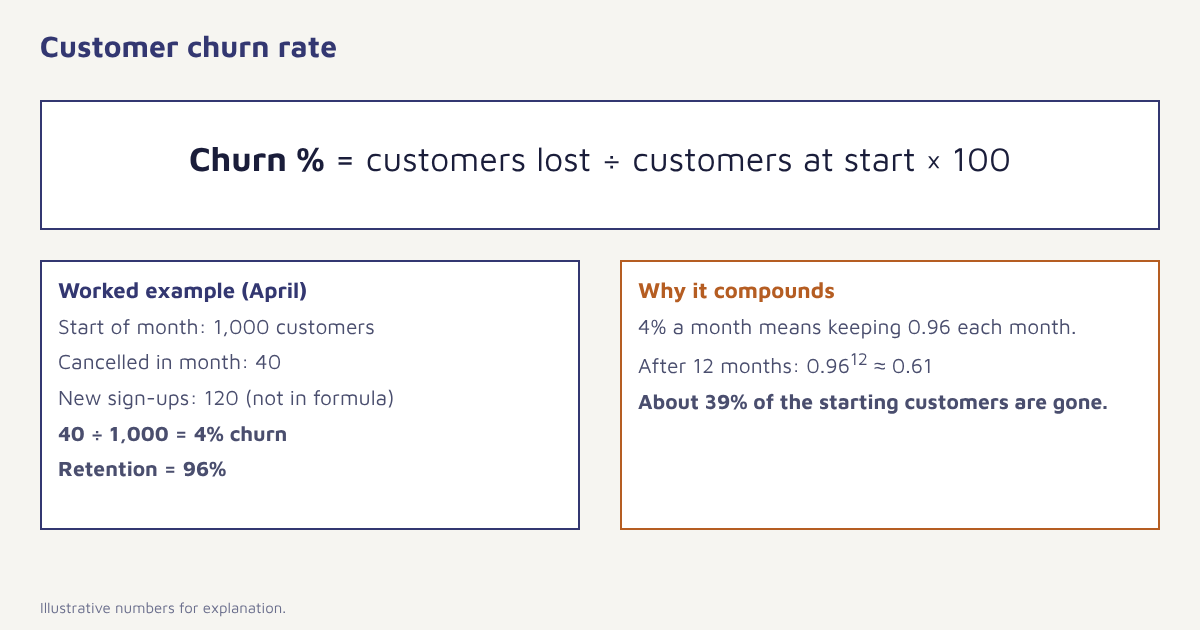
Formula. Churn rate (%) = (customers lost during the period ÷ customers at the start of the period) × 100
Two cautions. Use the same period for the numerator and the denominator, and leave customers who joined during the period out of the calculation. If you count new sign-ups who churn in their first week in the numerator but not the denominator, you will overstate churn.
Worked example
A subscription app starts April with 1,000 customers. During April, 40 cancel and 120 new customers join. Churn is 40 ÷ 1,000 = 4 percent. The 120 new customers do not enter the formula until May. Over a year, a steady 4 percent monthly rate compounds: roughly 1 − (0.96)12, or about 39 percent of the original customers gone by April next year. This is why a number that sounds small on a monthly report can alarm you on an annual one.
Types of churn you should track
| Metric | Formula | Use it when |
|---|---|---|
| Customer (logo) churn | Customers lost / customers at start | Counting accounts or users |
| Gross revenue churn | (Lost recurring revenue + downgrades) / revenue at start | Seeing how much recurring revenue leaks |
| Net revenue churn | Gross revenue churn minus expansion revenue | Seeing the effect of upsell and cross-sell |
| Net revenue retention | (Starting revenue + expansion − contraction − churn) / starting revenue | Reporting on growth inside the existing base |
| Voluntary churn | Customers who chose to leave | Fixing product, price or experience |
| Involuntary churn | Customers lost to failed payments | Fixing billing and retry logic |
Revenue churn matters because customers are not equal. Losing one enterprise account worth ten times the average can outweigh ten small cancellations. Track both views, then segment them by plan, acquisition source and tenure.
How to calculate churn from your data
If you keep subscriptions in a database, a query like this returns monthly churn. Adjust table and column names to your schema.
SELECT
  DATE_FORMAT(month_start, '%Y-%m') AS month,
  COUNT(*) AS customers_at_start,
  SUM(CASE WHEN cancelled_at >= month_start
            AND cancelled_at <  month_start + INTERVAL 1 MONTH THEN 1 ELSE 0 END) AS churned,
  ROUND(100 * SUM(CASE WHEN cancelled_at >= month_start
            AND cancelled_at <  month_start + INTERVAL 1 MONTH THEN 1 ELSE 0 END) / COUNT(*), 2) AS churn_pct
FROM (
  SELECT s.id, s.cancelled_at, m.month_start
  FROM subscriptions s
  JOIN months m
    ON s.started_at < m.month_start
   AND (s.cancelled_at IS NULL OR s.cancelled_at >= m.month_start)
) t
GROUP BY month_start
ORDER BY month_start;
For non-subscription businesses, define an inactivity window (for example, no order in 180 days) and count customers who cross it. Pick a window based on your natural repeat cycle: a grocery app might use 30 days, a furniture store 18 months.
What is a good churn rate?
It depends on who you sell to. Consumer subscriptions typically churn faster than business software, and small-business customers faster than enterprise accounts. As rough guidance used in many SaaS discussions, annual churn in the single digits is considered strong for business software, while consumer apps often see far higher numbers. Treat these as orientation, not targets: your own trend and your segments tell you more than an industry average.
| Business model | Typical shape of churn | What to watch |
|---|---|---|
| B2B SaaS, enterprise | Low and lumpy, driven by renewals | Net revenue retention above 100% |
| B2B SaaS, SMB | Moderate, sensitive to price and onboarding | First 90 days |
| Consumer subscription | Higher, front-loaded | Trial to paid, first month |
| Ecommerce and marketplaces | No cancellation event, based on inactivity | Repeat purchase rate and days between orders |
Why customers leave
Churn reasons cluster into a few themes. Interview recent churners and tag what you hear.
- They never got started. Slow or confusing onboarding is the biggest early cause. If someone does not reach a first win quickly, they drift away.
- Poor fit. Marketing promised something the product does not do, or the buyer was not the user.
- Price versus perceived value. Often a communication problem: customers are not reminded of what they are getting.
- Service failures. Slow support, repeated bugs, late deliveries.
- Failed payments. Expired cards and UPI mandate failures cause a surprising share of subscription churn.
- Competitors. Sometimes they simply found something better.
How to reduce churn
- Measure it by segment. Split churn by plan, channel of acquisition, country and tenure. The average hides the real story.
- Fix the first 30 days. Make onboarding short, guided and measured. See how teams do this in the onboarding use case.
- Spot risk early. Build a segment of customers whose usage has dropped, who have not logged in for two weeks or whose last order is overdue. Segments update themselves as behaviour changes.
- Reach out on the right channel. A well-timed WhatsApp message or email beats a discount blast. Offer help before offering money.
- Recover failed payments. Retry intelligently, send payment-update links by SMS or WhatsApp, and avoid waiting a week to tell customers their card failed.
- Ask people why they leave. Add a one-question exit survey and read the answers every month.
- Reward loyalty. Tenure benefits, early access and personal check-ins keep good customers close.
Prevent, then win back. Win-back campaigns recover some lapsed customers, but it is cheaper to keep a customer than to reacquire one. Invest in early warning first.
Why a small change in retention matters
The often-quoted result from Frederick Reichheld’s research with Bain & Company is that raising retention by 5 percentage points can raise profits by between 25 and 95 percent, depending on the industry. It is cited widely, including in Harvard Business Review, and it is worth reading as direction rather than a promise: the effect you get depends on margins and how long customers stay. The logic is easy to follow. Retained customers cost little to serve, tend to buy more over time, and raise your customer lifetime value.
Acquisition fills the bucket. Retention decides how much water is still in it next year.
How Flowfox helps you reduce churn
Churn work is mostly a loop of spotting, reaching out and checking what happened. Each step has a home in the platform:
- Analytics show retention by cohort, so you can see when customers fall away.
- Segments build at-risk lists from behaviour and update automatically.
- Journeys send timed, multi-channel help when risk signals appear.
- FoxAI helps draft and personalise the outreach.
If you want a ready starting point, the churn prevention use case and the retention use case contain journeys you can install and adjust. SaaS teams can also read how the SaaS solution connects product events to messages, and media and subscription businesses can look at the media solution. Setting up the data first? Follow the events guide and the data model overview.
Catch churn before it happens. Build an at-risk segment and a rescue journey in an afternoon.
Common mistakes when measuring churn
- Mixing periods. Compare monthly with monthly and annual with annual.
- Counting new customers in the denominator. Use the starting base only.
- Ignoring involuntary churn. Failed payments look like cancellations in the totals but need a different fix.
- Relying on one average. Segment by cohort, plan and channel.
- Optimising the metric, not the customer. Hiding the cancel button lowers churn this quarter and damages trust next year.
Mapping where customers lose momentum is a good companion exercise: our customer journey mapping guide shows how. For channel tactics, see abandoned cart recovery for commerce and the blog for more playbooks. You can also check the glossary for definitions of terms used here.
Frequently asked questions
What is customer churn rate?
It is the percentage of customers who stop buying or cancel during a period. Divide customers lost by customers at the start of the period and multiply by 100.
How do you calculate churn rate?
Churn rate = (customers lost in the period / customers at the start of the period) x 100. For example, losing 40 of 1,000 customers in a month gives 4 percent monthly churn.
What is a good customer churn rate?
It varies by model. Enterprise software often aims for low single-digit annual churn, while consumer subscriptions see higher rates. Compare against your own trend and segments before industry averages.
What is the difference between customer churn and revenue churn?
Customer churn counts accounts lost. Revenue churn measures recurring revenue lost, including downgrades. A few large accounts leaving can make revenue churn much worse than customer churn.
What causes customers to churn?
Common causes are poor onboarding, a mismatch between promise and product, price versus value, service problems, failed payments and better alternatives.
How can I reduce churn?
Improve the first 30 days, track at-risk behaviour, contact customers early on their preferred channel, recover failed payments, collect exit feedback and reward loyalty.
Is churn rate the same as retention rate?
They are opposites. Retention rate is 100 percent minus churn rate for the same period.