A customer journey map is a picture of everything a person does, thinks and feels from the moment they first hear about you to the point they buy again or leave. Teams build one to find the places where good intentions fall apart: the form that asks for too much, the welcome email that arrives three days late, the support chat nobody answers on Sunday. This guide explains what journey mapping is, gives you a template you can copy, walks through a worked ecommerce example, and shows how to turn the map into messages that actually send.
What is customer journey mapping?
Customer journey mapping is the practice of laying out, in order, the steps a customer takes while trying to achieve a goal with your company, along with the touchpoints they use and the emotions they have at each step. It sits inside the wider discipline of customer experience. The research group Nielsen Norman Group describes a journey map as a visualisation of the process a person goes through to accomplish a goal, and stresses that it should be grounded in real research rather than assumptions made in a meeting room.
That last point matters more than any template. A map drawn from opinion produces a tidy poster and no change. A map drawn from interviews, support tickets and event data produces a short list of fixes you can ship next month.
Why it is worth the effort
- It exposes handoffs. Most drop-offs happen where one team ends and another begins: marketing to sales, checkout to fulfilment, onboarding to support.
- It gives teams a shared picture. Product, marketing and support usually see different slices of the same customer. The map puts them on one page.
- It tells you what to automate. Every gap between two stages is a candidate for a triggered message or an in-app prompt.
- It keeps you honest about retention. Maps that stop at the first purchase miss the part of the journey where most of the profit sits.
The stages of a customer journey
Different industries use different labels, but five stages cover most journeys.
| Stage | Customer goal | Typical touchpoints | Question to answer |
|---|---|---|---|
| Awareness | Find out the problem has a solution | Search, social posts, ads, referrals | How do people discover us? |
| Consideration | Compare options | Website, reviews, demo, pricing page | What makes them hesitate? |
| Purchase or sign-up | Commit | Checkout, trial form, sales call | Where do they stall? |
| Onboarding and use | Get first value | Welcome messages, setup flow, support | How fast do they reach a first win? |
| Retention and advocacy | Keep getting value, recommend you | Renewals, loyalty offers, reviews, referrals | What makes them stay or leave? |
What goes into a journey map
A useful map has a small number of rows. More than seven and nobody reads it.
- The persona and scenario. One person, one goal. “First-time buyer replacing a worn pair of running shoes” works. “All customers” does not.
- Stages. The phases above or your own.
- Actions. What the customer actually does at each stage.
- Touchpoints. Every place they meet you: ad, website, email, WhatsApp, app, store, support line.
- Thoughts and feelings. A line or a simple curve from frustrated to delighted.
- Pain points. What gets in the way.
- Opportunities. What you will change, with an owner.
How to create a customer journey map
- Set one clear objective. Decide what the map is for: reducing checkout drop-off, speeding up onboarding, cutting early churn. A scoped map finishes; a general one never does.
- Choose a single persona. Pick the segment that matters most to revenue right now. You can map others later.
- Collect evidence. Run five to eight customer interviews, read support tickets and reviews, and pull funnel numbers from analytics. Mix what people say with what they do.
- List the touchpoints. Walk the journey yourself as the customer, including the confirmation email, the invoice and the cancellation page.
- Draw the stages and fill in actions, feelings and pain points. Use sticky notes, a whiteboard or a spreadsheet. Keep the language of real customers.
- Mark the moments of truth. Circle the two or three points where the customer decides to continue or give up.
- Turn pain points into actions. Assign each opportunity an owner and a date, and decide how you will measure it.
- Review every quarter. Journeys change as products, prices and channels change. A map that is a year old is a historical document.
Data beats guesswork. If you already track events such as signup_completed or checkout_started, your first pass can come from a funnel report. Find the biggest drop between two steps and interview the people who stopped there.
Worked example: an online footwear store
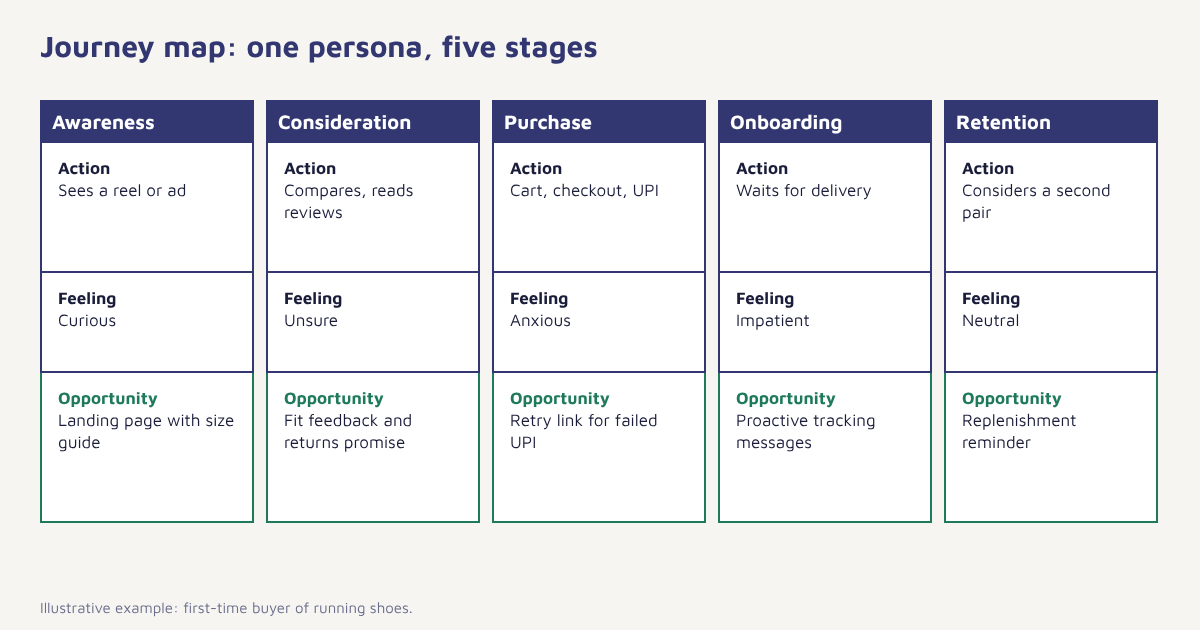
Take the persona “Meera, first-time buyer of running shoes”. The numbers below are illustrative and show how a map turns into decisions.
| Stage | What Meera does | Touchpoint | Feeling | Opportunity |
|---|---|---|---|---|
| Awareness | Sees an Instagram reel from a runner | Social, creator content | Curious | Add a UTM-tagged landing page with size guide |
| Consideration | Compares three pairs and reads reviews | Product page, reviews | Unsure about fit | Show fit feedback and an easy returns promise |
| Purchase | Adds to cart, pays on UPI | Cart, checkout | Anxious about payment failure | Offer retry link on failed UPI and send status on WhatsApp |
| Onboarding | Waits for delivery | Order emails, courier SMS | Impatient | Send tracking proactively; add care tips on arrival |
| Retention | Considers a second pair after three months | Email, WhatsApp, app | Neutral | Send a replenishment reminder and a loyalty offer |
Notice what the map did. It did not say “improve marketing”. It surfaced three specific, ownable changes: a fit guide, a payment-retry message, and a replenishment reminder. Each of those is a message you can build once and let run.
Journey map vs related tools
| Customer journey map | Service blueprint | User flow | |
|---|---|---|---|
| Focus | Customer experience over time | Backstage processes behind each step | Screens and clicks inside a product |
| Main question | How does it feel and where does it break? | Which team or system delivers each step? | How does the user move through the interface? |
| Best used by | Marketing, CX, product | Operations, service design | UX and product design |
| Output | Pain points and opportunities | Process gaps and ownership | Screen-level fixes |
Metrics to attach to each stage
A map without numbers drifts. Attach one primary measure to each stage so you know whether a change helped.
| Stage | Primary metric | Where it comes from |
|---|---|---|
| Awareness | New visitors and sign-ups by source | Web analytics, UTM data |
| Consideration | Product page to cart rate | Event tracking |
| Purchase | Checkout completion rate | Funnel report |
| Onboarding | Time to first value | Event timestamps |
| Retention | Repeat purchase rate or retention by cohort | Cohort analysis |
For retention in particular, a cohort view shows whether customers who joined in a given month keep coming back, and it is more honest than a single average. You can build these views in Flowfox under analytics.
From map to automation
This is the step most guides skip. A journey map describes what customers do. A journey in a marketing platform is the set of rules that responds to what they do. Each opportunity on your map can become a trigger, a wait and a message.
{
  "trigger": "checkout_started",
  "wait": "60 minutes",
  "if_not": "purchase_completed",
  "send": [
    { "channel": "whatsapp", "template": "cart_reminder" },
    { "channel": "email", "template": "cart_reminder_email", "delay": "24 hours" }
  ],
  "exit_when": "purchase_completed"
}
That sketch is what Flowfox journeys build visually: events start the path, segments decide who qualifies, and goals stop the messages once the customer converts. Our first journey tutorial and the guide to goals and waits take about twenty minutes to follow. If you want ready-made starting points, the onboarding and retention use cases contain journeys you can adapt, and the abandoned cart recovery guide shows the checkout example from this article in full.
A journey map shows you where customers struggle. A journey in your platform is how you show up there in time.
Common mistakes
- Mapping the company, not the customer. If your stages are internal department names, start again.
- Skipping research. Workshop-only maps reproduce your own assumptions.
- Trying to map everyone. One persona per map keeps the picture sharp.
- Stopping at purchase. Post-sale is where repeat revenue and referrals live.
- Filing it away. Pin the map where teams plan work, and review it each quarter.
Turn your map into live journeys. Build triggers, waits and multi-channel messages for each moment of truth in Flowfox.
If you run an online store, the ecommerce solution bundles events and journeys for the stages above. Subscription and software teams can look at the SaaS solution. For more on keeping customers once they have joined, read our guide to customer churn rate and browse the Flowfox blog.
Frequently asked questions
What is a customer journey map?
A customer journey map is a visual timeline of the steps a customer takes to reach a goal with your business, including the touchpoints they use, what they think and feel, where they get stuck and what you can change.
What are the 5 stages of the customer journey?
The common five are awareness, consideration, purchase, onboarding or use, and retention or advocacy. Some teams add a separate loyalty stage or split purchase into decision and delivery.
How do I create a customer journey map?
Pick one objective and one persona, gather evidence from interviews, support tickets and analytics, list touchpoints, draw the stages with actions, feelings and pain points, mark the moments of truth and assign owners to each opportunity.
What is the difference between a customer journey map and a sales funnel?
A funnel counts how many people move between stages. A journey map explains why they move or stop, and includes emotions, touchpoints and post-purchase behaviour.
How many touchpoints should a journey map include?
Include the ones that matter to the chosen scenario, usually between ten and twenty. Too many make the map unreadable.
What tools can I use to build a journey map?
A whiteboard, a spreadsheet or a diagramming tool is enough. Pair it with analytics and a marketing automation platform so insights become live campaigns.
How often should I update a customer journey map?
Review it at least every quarter and whenever you launch a new product, change pricing or add a channel.