Not all customers are equally valuable, and the difference rarely shows up in a plain list of names. RFM analysis is a simple, long-established way to see it. It scores every customer on three questions: how recently did they buy, how often do they buy and how much do they spend. The result is a handful of clear groups, from loyal champions to customers on the verge of leaving, each of which deserves a different message. This guide explains RFM, shows how to calculate it with a worked example, lists the segments and what to send each, and covers the limits you should know about.
What is RFM analysis?
RFM stands for recency, frequency and monetary value. It comes from direct marketing, where catalogue sellers needed to decide who deserved the next mailing. The idea still holds: customers who bought recently, buy often and spend more are more likely to respond than customers who did none of these. Because RFM needs only order data, it is one of the easiest ways to start with behavioural customer segmentation, and it sits comfortably beside measures such as customer lifetime value.
| Letter | Question | Data needed | Typical signal |
|---|---|---|---|
| R: Recency | How long since the last purchase? | Date of last order | Recent buyers are warmer |
| F: Frequency | How many orders in a period? | Order count | Repeat buyers are more loyal |
| M: Monetary | How much have they spent? | Order values | Bigger spenders are more valuable |
How to calculate RFM scores
- Choose the period. Use a window that fits your buying cycle, such as the last 12 months for fashion or 24 months for durable goods.
- Pull one row per customer. You need the date of the last order, the number of orders and the total spend in the window.
- Score each measure from 1 to 5. Rank customers and split them into five equal groups (quintiles). For recency, the most recent group gets 5. For frequency and monetary, the highest group gets 5.
- Combine the scores. Write them as a three-digit code, such as 555 for the best customers or 211 for those who bought once long ago.
- Group the codes into segments. There are 125 possible codes, which is too many to act on, so cluster them into eight to ten named segments.
- Attach a play to each segment. Decide the message, channel and offer for each one.
- Refresh regularly. Recalculate monthly, because customers move between groups.
A worked example
Take four customers from an online store, measured over the last 12 months.
| Customer | Last order | Orders | Spend (Rs) | R | F | M | Code |
|---|---|---|---|---|---|---|---|
| Asha | 6 days ago | 9 | 21,400 | 5 | 5 | 5 | 555 |
| Ravi | 48 days ago | 4 | 7,200 | 4 | 4 | 4 | 444 |
| Meera | 190 days ago | 6 | 11,800 | 2 | 5 | 4 | 254 |
| Karan | 320 days ago | 1 | 1,299 | 1 | 1 | 1 | 111 |
Asha is a champion. Ravi is a solid regular. Meera used to buy often and spend well, but nothing for over six months, which makes her a high-value customer at risk. Karan bought once and disappeared. Each of the four needs a different message, which is the whole point of the method. The scores here are an illustration of the arithmetic, since the cut-offs for each score depend on your own distribution.
RFM segments and what to send
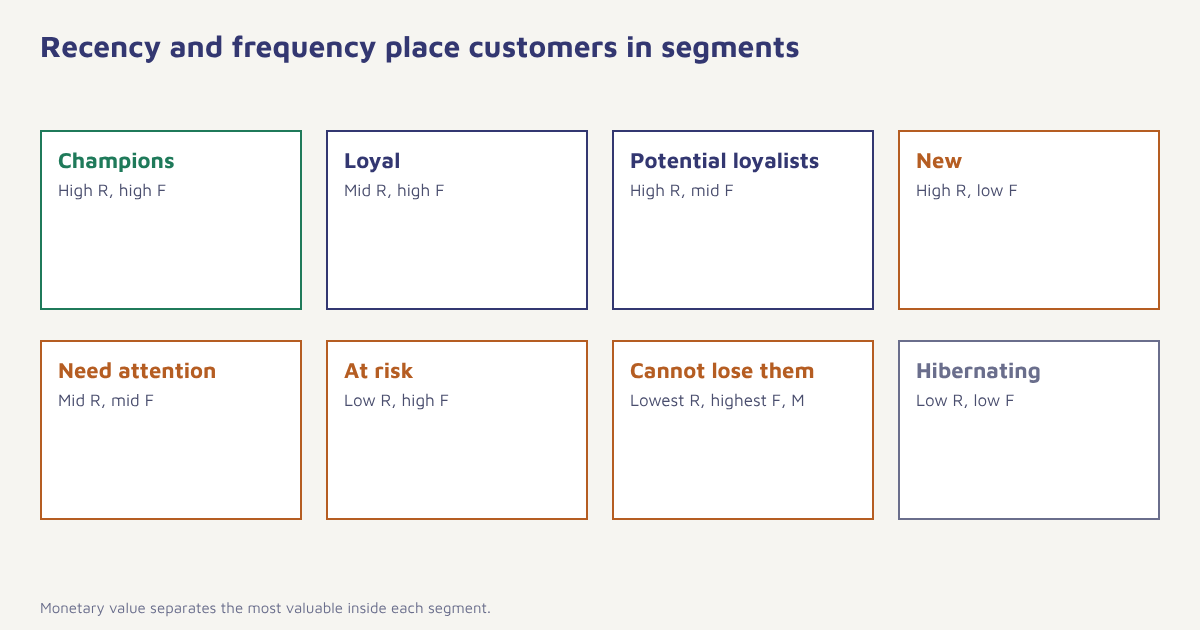
| Segment | Typical pattern | What to do |
|---|---|---|
| Champions | Bought recently, often, spend most | Thank them, early access, ask for reviews and referrals; do not discount heavily |
| Loyal customers | Frequent, good spend | Loyalty rewards, cross-sell related products |
| Potential loyalists | Recent, a few orders | Encourage the next purchase; membership offers; helpful content |
| New customers | Very recent, one order | Onboarding, care tips, a gentle second-purchase nudge |
| Promising | Recent, low spend | Introduce bundles and best-sellers |
| Need attention | Average on all three | Reminders and personalised recommendations |
| At risk | Used to buy often, gone quiet | Win-back offer, personal note, ask what changed |
| Cannot lose them | High past value, lapsed | Direct outreach, best offer, human follow-up |
| Hibernating | Low on all three | Low-cost reactivation; sunset if no response |
Match effort to value. A phone call or a personal discount may be worth it for a lapsed high-value customer. For hibernating customers, a cheap automated email is enough, and silence after two or three tries is a fair answer.
Using RFM in Flowfox
You do not need a data science team to run this. Orders arrive as events through the data model or FlowConnect. Computed attributes on the contact profile, such as days since last order, order count and total spend, give you the three measures. In the segment builder you can then create rules like “order count is at least 4, days since last order is under 60 and total spend is above Rs 10,000” for champions, and the mirror image for at-risk groups. Each segment can feed a journey with the right messages across email, WhatsApp and SMS. The retention use case shows a ready pattern.
{
  "segment": "At risk",
  "match": "all",
  "rules": [
    { "attribute": "orders_12m", "op": ">=", "value": 4 },
    { "attribute": "days_since_last_order", "op": ">", "value": 120 },
    { "attribute": "days_since_last_order", "op": "<=", "value": 365 },
    { "attribute": "consent.email", "op": "=", "value": true }
  ]
}
What RFM is good for
- Targeting. Send richer offers to valuable segments and fewer messages to the rest.
- Win-back. Find lapsed valuable customers before they are gone for good. See our guide to customer retention strategies and churn rate.
- Budget. Spend acquisition money on audiences that look like your champions.
- Personalisation. Tailor tone and content to the relationship. See marketing personalization.
- Measurement. Track how many customers move up or down between groups each month.
Limits and pitfalls
RFM looks backwards. It describes what customers have done, not why, and it says nothing about those who have not bought yet. It treats a customer who bought a rarely purchased item, such as a sofa, as if they were a lapsed regular, so adjust the window to the product. Monetary value can mislead when a few big orders dominate, and it ignores margin, so a high-spending customer who returns half of what they buy may be less valuable than the score suggests. Finally, it is a simple form of market segmentation, which is excellent as a starting point and less so as the whole strategy. Combine it with product interest, channel preference and lifecycle stage as your data grows.
For a more rigorous look at how groups behave over time, pair RFM with cohort analysis. For larger datasets, some teams replace quintile scoring with clustering, such as the k-means method described in the k-means article, but the simple version is often enough and is easy to explain to colleagues.
Common mistakes
- Too many segments. If you cannot write a different message for each, merge them.
- One-size period. Use a window that suits how often people really buy.
- Discounting champions. They would have bought anyway. Reward, do not subsidise.
- Never refreshing. Customers move. Recompute at least monthly.
- Ignoring consent. A segment is not permission to message on every channel.
RFM will not tell you everything about a customer. It will tell you who to call first.
Put RFM to work. Build recency, frequency and value segments and trigger the right journey for each.
Next, read about customer lifetime value and abandoned cart recovery, and browse the blog.
Frequently asked questions
What does RFM stand for?
RFM stands for recency, frequency and monetary value: how recently a customer bought, how often they buy and how much they spend.
How do you calculate RFM scores?
Pull last order date, order count and total spend for each customer, rank them on each measure, split into five groups and give scores from 1 to 5, with 5 being the best. Combine the three scores into a code such as 555.
What is a good RFM segment?
Champions are the best: they bought recently, buy often and spend the most. Loyal customers and potential loyalists come next.
How often should I update RFM scores?
Monthly is common, or weekly for fast-moving businesses. Customers shift between groups as they buy or go quiet.
What data do I need for RFM analysis?
Only transaction data: a customer identifier, order dates and order values. Clean, deduplicated customer records matter most.
What is the difference between RFM and CLV?
RFM scores past behaviour with simple measures. Customer lifetime value estimates the total value a customer will bring, often using predicted future purchases and margin.
Can RFM be used for B2B?
Yes, with a window and thresholds that fit longer buying cycles. Frequency and monetary value can be measured at account level.