Not every lead is equally ready to buy. One has visited your pricing page three times and asked for a demo; another downloaded a guide a month ago and never came back. If sales treats them the same, it wastes time on the wrong people and keeps the right ones waiting. Lead scoring solves this by giving each lead a number that reflects how well they fit your ideal customer and how interested they are. This guide explains what lead scoring is, the two kinds of score, how to build a points model step by step, a worked example, how to use scores in automation, and how to keep the model honest over time.
What is lead scoring?
Lead scoring is a method of ranking leads by assigning points for attributes and actions that suggest a likelihood to buy. When a lead reaches a chosen threshold, it is marked as sales-ready, and the team follows up. Below the threshold, the lead stays in nurturing. The method comes from B2B sales, where deals are large and teams are small, but the idea also helps B2C and subscription businesses that need to separate browsers from serious buyers. It is closely related to lead nurturing and sits in the middle of the marketing funnel.
Two kinds of score
| Score | Based on | Examples | Changes how fast? |
|---|---|---|---|
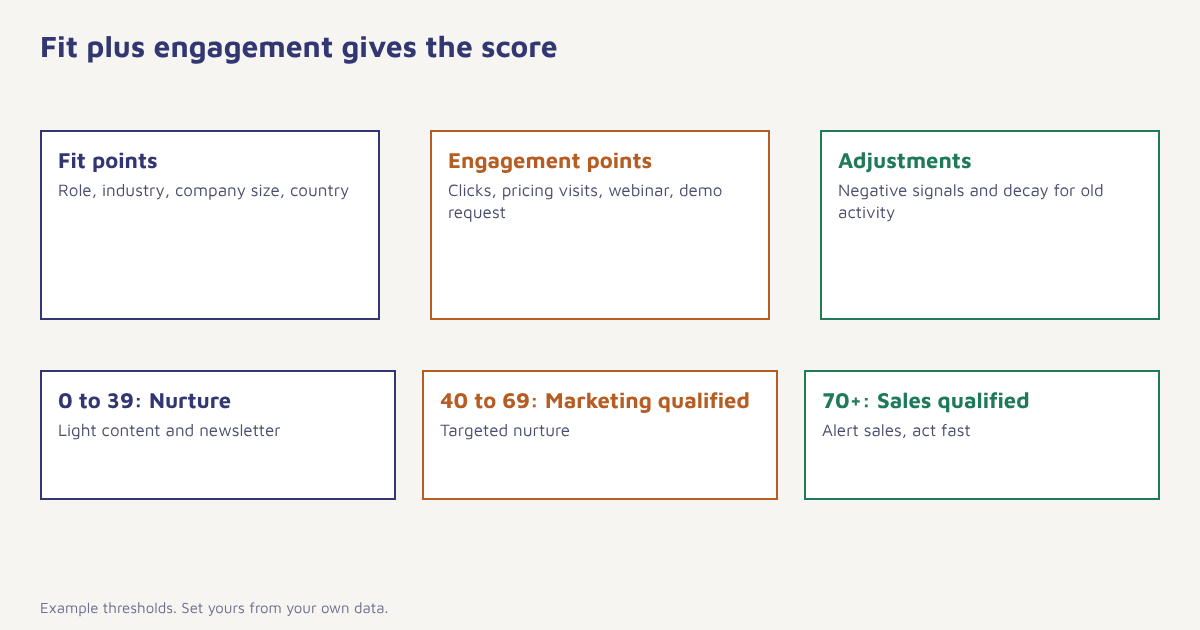
| Fit (explicit) | Who the lead is | Job title, industry, company size, country, budget | Slowly |
| Engagement (implicit) | What the lead does | Page visits, email clicks, demo request, replies, product usage | Quickly |
| Negative | Signs of a poor match | Student email address, competitor, unsubscribed, long inactivity | As it happens |
Using both is important. A perfect-fit lead who has never engaged is not ready. A highly engaged lead who is a poor fit, such as a student researching for a project, wastes sales time. A two-axis view (fit and engagement) is often clearer than one blended number, and many teams show a simple grid with high fit and high engagement in the top corner.
How to build a lead scoring model
- Define a good customer. Look at your best existing customers. What do they have in common: industry, size, role, source, early behaviour?
- Agree the handover point with sales. Decide what a marketing-qualified lead and a sales-qualified lead mean, in writing.
- List fit attributes and actions. Include data you actually collect and can rely on.
- Assign points. Give more points to strong signals, such as a demo request, and fewer to weak ones, such as a blog visit.
- Add negative points and decay. Subtract for poor-fit signs and reduce points for old activity.
- Set thresholds. For example 0 to 39 nurture, 40 to 69 marketing qualified, 70 and above sales qualified.
- Test against history. Check that past customers would have scored high and past non-buyers low.
- Launch, review and adjust. Sit with sales monthly at first.
A worked example
Take a software company selling to mid-sized online retailers. The points below are invented to show how a model might look. Real values should come from your own data.
| Signal | Type | Points |
|---|---|---|
| Job title is marketing head or owner | Fit | +15 |
| Retail or ecommerce industry | Fit | +15 |
| Company with 20 to 500 employees | Fit | +10 |
| Based in a target country | Fit | +5 |
| Opened an email in last 30 days | Engagement | +2 |
| Clicked a link in an email | Engagement | +5 |
| Visited the pricing page | Engagement | +10 (once per week) |
| Attended a webinar | Engagement | +10 |
| Requested a demo | Engagement | +30 |
| Free email address (personal domain) | Negative | −5 |
| Competitor domain | Negative | −50 |
| No activity for 60 days | Decay | −10 |
A lead who is the owner of a 100-person retailer in a target country starts with 45 fit points. After clicking two emails and visiting the pricing page (20 more) they reach 65, a marketing-qualified lead who keeps getting nurturing. When they request a demo (+30) they jump to 95 and sales is alerted at once. A student with a personal email who downloads three guides might reach only 20. A thought for the grid: the first lead sits at high fit and growing engagement, so the action is a sales call; the student sits at low fit, so the action is to stay in a light newsletter only.
Keep it simple at first. Ten to fifteen signals are enough to start. A model with fifty rules is hard to explain and nearly impossible to debug. If sales cannot say why a lead scored high, the score will not be trusted.
Using scores in automation
A score is only useful if it changes what happens. In Flowfox, the lead score can be an attribute on the contact profile, updated by events as they arrive, and the segment builder can create live audiences such as “score 40 to 69” and “score 70 or more”. A journey can then send a different path to each: educational content to lower scores, a case story and a call-to-action to middle scores, and a task or alert for the sales team at the threshold. The data model explains how events and attributes are stored, and FlowConnect can pass the score to your CRM.
| Score band | Action |
|---|---|
| Low | Light nurture: newsletter, useful guides |
| Middle | Targeted nurture: case stories, comparisons, webinar invitation |
| High | Alert sales, personal email, call within a set time |
| Falling fast | Re-engagement message or pause outreach |
Speed matters at the top. Many studies suggest that response time to a hot lead affects the chance of a meeting, though the exact figures vary by industry and source. Set a service level, for example a call within one working hour, and monitor it. For consumer businesses with many small purchases, the same idea works with behavioural scoring: visits, cart actions and repeat orders. See behavioral segmentation and RFM analysis.
Keeping the model accurate
- Review closed deals. Compare scores at handover with outcomes. Raise points for signals that predicted wins and lower those that did not.
- Use decay. Interest fades, so old activity should count for less.
- Collect feedback from sales. If good leads are missed or bad ones appear, find out why.
- Watch for gaming. Bots and repeated clicks can inflate scores. Cap points per action.
- Respect privacy. Tell people what you track and use consent. See the DPDP Act guide.
More advanced teams use predictive scoring, where a statistical model learns from past data which attributes predict a purchase. It can find patterns people miss but needs enough history and care to avoid bias. Start with a points model you can explain, then consider predictive methods as your data grows. The wider topic of predictive analytics is a good starting point for reading.
Working with the sales team
A scoring model fails most often because marketing and sales build it separately. Hold a short workshop. Ask sales to describe their last ten wins and ten losses, and what the leads looked like before the first call. Note which signals the team trusts: an inbound demo request, a reply to a personal email, a visit to the pricing page from a named company. Write the handover rule on one page, including how fast sales will respond and what marketing will keep doing for leads that are not ready. Agree on a feedback loop as well: sales marks each handed-over lead as accepted, rejected or already known, with a reason. Over a quarter, those reasons show which rules are too generous. If a lot of leads are rejected for the same cause, such as the wrong company size, change the fit points. Treat the score as a shared tool, not marketing’s report card. Most CRM systems, described in the article on customer relationship management, can record these accept and reject reasons. Teams that do this tend to argue less about lead quality, because both sides can see the same evidence and adjust it together.
Common mistakes
- Building without sales. The score must match what sales thinks is ready.
- Guessing points. Use your own customer data.
- Only engagement. Fit matters just as much.
- No decay. Old leads stay hot forever.
- Set and forget. Markets and buyers change.
A lead score does not tell you who will buy. It tells you who deserves a human’s time first.
Route the right leads to sales. Score leads from events and trigger alerts and journeys automatically.
Read next: welcome email series, customer segmentation and the blog.
Frequently asked questions
What is lead scoring?
Lead scoring ranks leads by assigning points for attributes and actions that indicate how well they fit your ideal customer and how interested they are, so that sales focuses on the most promising ones.
What is the difference between fit and engagement scoring?
Fit scoring uses who the lead is, such as role, industry and company size. Engagement scoring uses what the lead does, such as email clicks, page visits and demo requests.
How do I set a lead scoring threshold?
Agree with sales what a sales-ready lead looks like, then test thresholds against past leads to see which score best separates buyers from non-buyers.
What is negative lead scoring?
Negative scoring subtracts points for signs of a poor match, such as personal email addresses, competitor domains or long inactivity.
How many criteria should a lead scoring model have?
Start with ten to fifteen signals. Too many rules make the model hard to explain and maintain.
Can lead scoring be used in B2C?
Yes. Behavioural scores based on visits, cart actions and repeat purchases help separate browsers from likely buyers.
How often should I review my lead scoring model?
Review it monthly at first with sales, then quarterly, comparing scores with actual outcomes and adjusting the points.