Customer lifetime value, usually shortened to CLV or LTV, is the total profit or revenue you can expect from one customer over the whole time they buy from you. It matters because it tells you how much you can afford to spend to win a customer, and which customers deserve extra attention. This guide gives you the formulas for ecommerce and subscription businesses, worked examples with the arithmetic shown, how to compare CLV with acquisition cost, and practical ways to raise it.
What is customer lifetime value?
Customer lifetime value is a prediction of the net value a customer will bring over the length of the relationship. Some teams measure it in revenue, which is simpler. Better teams measure it in gross margin, because revenue that costs almost as much to deliver is not worth as much. Either way, you should state which one you use and stick to it.
Why CLV matters
- It sets your acquisition budget. If a customer is worth Rs 6,000 over time, you can pay more to win them than if they are worth Rs 800.
- It shows who your best customers are. A small group usually produces a large share of profit.
- It guides retention spend. Raising the value of existing customers is often cheaper than finding new ones.
- It improves forecasting. Investors and finance teams use it to judge the health of the business.
Customer lifetime value formulas
Simple formula for ecommerce and repeat purchase
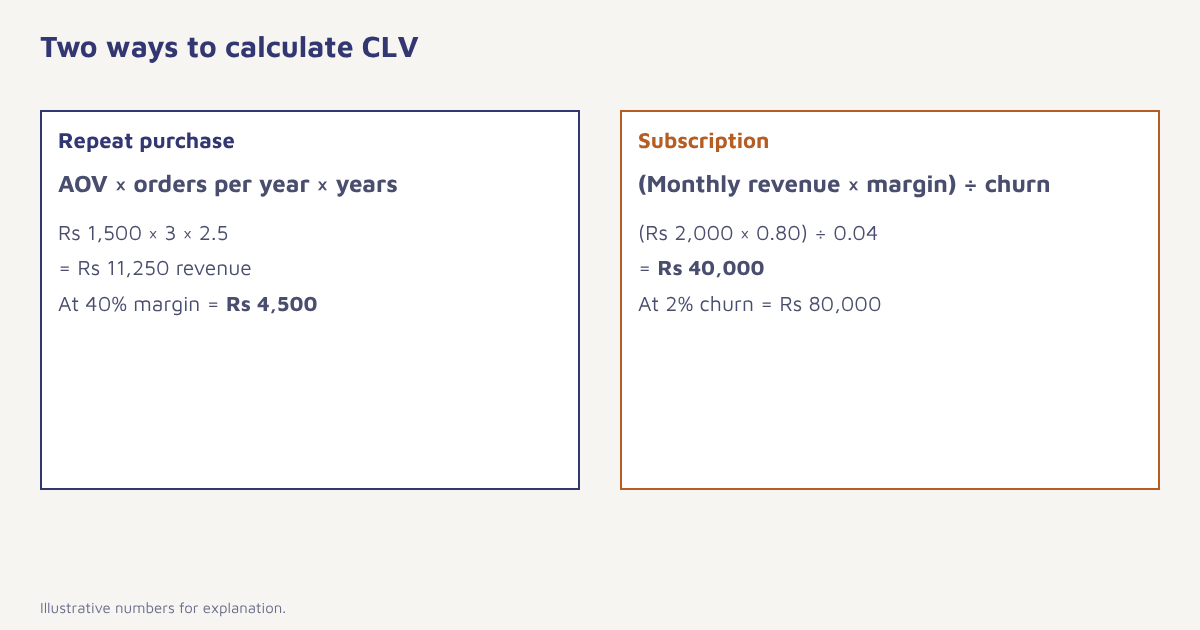
Formula. CLV = average order value × purchases per year × average customer lifespan in years
Suppose your average order is Rs 1,500, a typical customer buys 3 times a year, and customers stay for about 2.5 years. CLV = 1,500 × 3 × 2.5 = Rs 11,250 in revenue. If your gross margin is 40 percent, the margin-based CLV is 11,250 × 0.40 = Rs 4,500.
Formula for subscription businesses
Formula. CLV = (average monthly revenue per account × gross margin) ÷ monthly churn rate
Imagine a plan costing Rs 2,000 a month with an 80 percent gross margin and 4 percent monthly churn. CLV = (2,000 × 0.80) ÷ 0.04 = 1,600 ÷ 0.04 = Rs 40,000. A lower churn rate raises CLV quickly: at 2 percent churn the same plan is worth Rs 80,000. That is why our guide to customer churn rate matters to this number.
These are illustrative figures to show the method. Use your own data.
CLV vs customer acquisition cost
CLV alone is not enough. Set it against the cost of acquiring a customer (CAC), which is your sales and marketing spend divided by new customers won in the same period. A widely quoted rule of thumb among subscription businesses is a CLV to CAC ratio of about 3 to 1 or better, and a payback period (the time to recover CAC from margin) of under 12 months. Treat these as starting points rather than laws. A fast-growing business may accept a lower ratio for a time, and a business with long contracts may need a higher one.
| Ratio | What it usually suggests |
|---|---|
| Below 1 to 1 | You lose money on each customer you win |
| 1 to 3 | Thin return; look at retention and margin first |
| About 3 to 1 | Healthy for many subscription models |
| Well above 5 to 1 | Possibly under-investing in growth |
How to calculate CLV from your data, step by step
- Pick the unit. Choose revenue or gross margin, and choose a time window such as 12 or 24 months.
- Gather order or billing data. You need customer ID, date, amount and, ideally, product cost.
- Calculate average order value and frequency. Group orders by customer and take the average.
- Estimate lifespan or churn. Use cohort retention, or the inverse of churn for subscriptions.
- Calculate by segment. Compute CLV by acquisition channel, first product and city. The average hides large differences.
- Compare with CAC. Put the two side by side for each channel.
If you keep orders in a database, this query gives you realised value per customer to date, a useful starting point before you predict the future.
SELECT
  c.id,
  COUNT(o.id)                       AS orders,
  ROUND(AVG(o.total), 2)            AS avg_order_value,
  ROUND(SUM(o.total), 2)            AS revenue_to_date,
  ROUND(SUM(o.total - o.cogs), 2)   AS margin_to_date,
  DATEDIFF(MAX(o.created_at), MIN(o.created_at)) AS days_active
FROM customers c
JOIN orders o ON o.customer_id = c.id
GROUP BY c.id
ORDER BY margin_to_date DESC;
How to increase customer lifetime value
CLV rises when customers stay longer, buy more often or spend more per order. Each lever has its own tactics.
| Lever | Tactics |
|---|---|
| Stay longer | Strong onboarding, early-warning outreach, failed-payment recovery, win-back journeys |
| Buy more often | Replenishment reminders, loyalty rewards, back-in-stock alerts, lifecycle messages |
| Spend more per order | Bundles, free-shipping thresholds, relevant cross-sell and upsell, tiers |
| Cost less to serve | Self-service help, clear documentation, proactive notifications |
Our guide to customer retention strategies covers the first two levers in depth. For higher order value, see how ecommerce teams use recommendations, and SaaS teams use expansion nudges.
Segment by CLV
Once you can calculate CLV, split customers into tiers and treat them differently. The top tier gets early access and a personal touch. The middle tier gets nudges that push them up. The bottom tier gets low-cost automation. Customer segmentation explains how, and in Flowfox you can build a segment from lifetime value and order count in the segment builder, then attach a journey for each tier. Analytics shows CLV trends by cohort, and the data model explains how transactions feed it.
Historical vs predictive CLV
Historical CLV adds up what a customer has actually spent so far. It is easy to compute and honest, but it says little about newer customers who have only placed one order. Predictive CLV estimates future value from patterns such as order frequency, recency and how earlier cohorts behaved. You can start with a simple version: take the average repeat rate of last year’s customers and apply it to this year’s. A cohort analysis shows how value builds month by month, and statisticians have built more advanced models, but the basic cohort view is enough to make good decisions for most businesses.
How to work out acquisition cost
Customer acquisition cost is total sales and marketing spend in a period divided by the number of new customers won in that period. Include salaries, tools, agency fees and ad spend, not just the ad budget, or the ratio will look better than it is. Calculate it per channel. Paid search, referrals and email sign-ups usually differ widely, and a channel with a high CAC may still be worth it if its customers have a high CLV. That is the whole value of comparing the two numbers side by side.
What CLV looks like in different sectors
- Ecommerce: driven by repeat purchase rate. A replenishable product has a much higher CLV than a one-off item.
- SaaS: driven by churn and expansion. Upgrades can lift CLV without new customers.
- Edtech and services: driven by course completion and referrals.
- Fintech: driven by product adoption, since customers who use more than one product tend to stay longer.
Common mistakes
- Using revenue when margin is thin. It flatters low-margin products.
- Using one average for everyone. Break it down by channel and cohort.
- Assuming lifespan from too little data. New businesses should use shorter windows and update often.
- Ignoring discounting. Money received in three years is worth less than money today, which matters for long horizons.
- Calculating it once. Recompute quarterly.
If you only know what a customer costs to win, you are managing half the equation.
Know which customers are worth the most. Build value-based segments and tailored journeys in Flowfox.
For the leaking side of the equation read our notes on churn prevention, and browse more playbooks on the blog.
Frequently asked questions
What is customer lifetime value?
Customer lifetime value is the total revenue or profit a business can expect from a single customer over the entire relationship.
How do you calculate customer lifetime value?
For repeat purchase businesses multiply average order value by purchases per year and by average customer lifespan in years. For subscriptions divide average monthly revenue per account times gross margin by monthly churn rate.
What is a good CLV to CAC ratio?
A common rule of thumb for subscription businesses is about 3 to 1 or better, with a payback period under 12 months, though the right ratio depends on your model and growth plans.
Should I calculate CLV with revenue or profit?
Profit, ideally gross margin, gives a truer picture because it accounts for the cost of delivering the product. Revenue-based CLV is simpler but can overstate low-margin customers.
How can I increase customer lifetime value?
Help customers stay longer through onboarding and retention journeys, encourage more frequent purchases with reminders and loyalty, and raise order value with bundles and relevant upsells.
What is the difference between CLV and LTV?
They mean the same thing. CLV stands for customer lifetime value and LTV for lifetime value. Teams use them interchangeably.
How often should I recalculate CLV?
Quarterly is a good default, and whenever you change pricing, products or acquisition channels.