Customer retention rate answers a simple question: of the customers you had at the start of a period, how many are still with you at the end? It is one of the most useful numbers in a business, because keeping a customer is usually cheaper than winning a new one and a small improvement compounds over time. This guide gives the formula, a worked example, the related churn rate, how to calculate retention for different business models, ways to improve it and how to track it in your own data.
What is customer retention rate?
Customer retention rate is the percentage of existing customers who remain customers over a given period. It is the mirror image of churn: if 85 percent of customers stay, 15 percent have churned. Retention shows whether the product, service and experience deliver enough value that people continue, which makes it a health check for the whole business and not just for marketing.
The customer retention rate formula
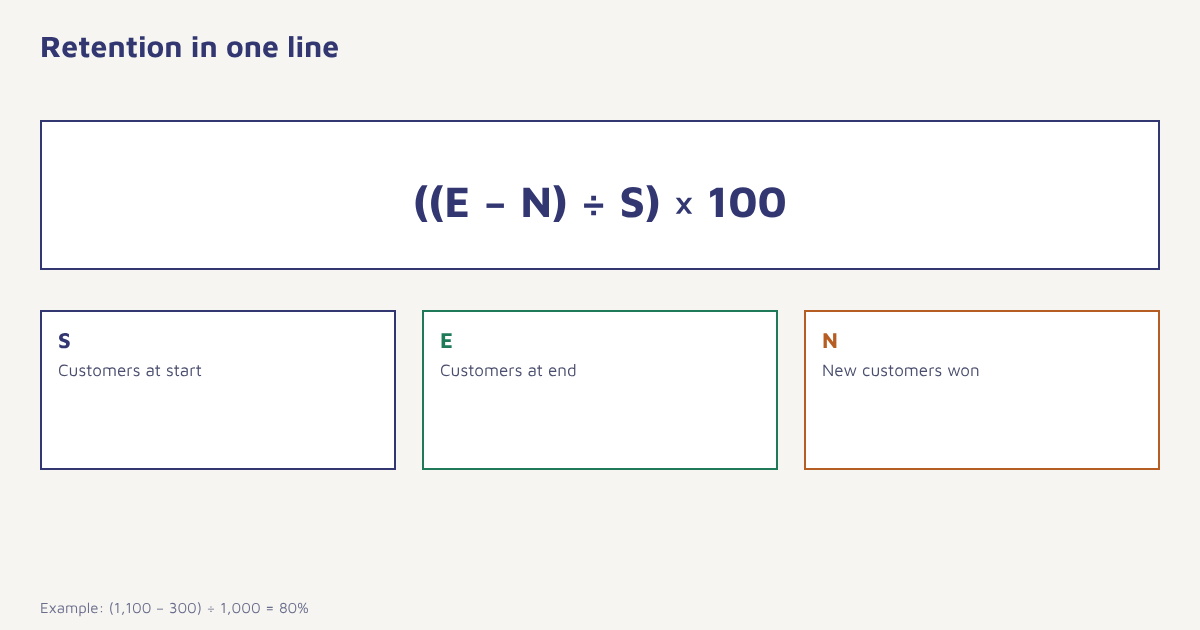
Formula. Retention rate (%) = ((E − N) ÷ S) × 100, where S = customers at the start of the period, E = customers at the end and N = new customers acquired during the period.
Subtracting N matters. Without it, a burst of new customers would hide the loss of old ones.
A worked example
Suppose an online store starts the quarter with 1,000 customers. During the quarter it wins 300 new ones, and it ends with 1,100 customers. The customers it kept are 1,100 − 300 = 800.
| Step | Calculation | Result |
|---|---|---|
| Customers at start (S) | Given | 1,000 |
| Customers at end (E) | Given | 1,100 |
| New customers (N) | Given | 300 |
| Customers retained | E − N | 800 |
| Retention rate | 800 ÷ 1,000 × 100 | 80% |
| Churn rate | 100% − 80% | 20% |
These numbers are invented to show the method. Use your own definitions of “customer” and “period” and apply them consistently.
Retention rate vs churn rate
| Measure | What it shows | Formula |
|---|---|---|
| Retention rate | Share of customers who stay | ((E − N) ÷ S) × 100 |
| Churn rate | Share of customers who leave | (Customers lost ÷ S) × 100 |
| Revenue retention | Share of revenue kept from existing customers | Revenue from the same customers now ÷ their revenue before |
| Repeat purchase rate | Share of buyers who buy again | Repeat customers ÷ all customers × 100 |
Retention and churn always add up to 100 percent for the same group and period. For subscription businesses, revenue retention is also important because customers who stay may buy more or less over time, a topic covered in churn rate literature and in our guide to customer churn.
Defining “retained” for your business
What counts as a retained customer depends on how people buy.
| Model | A customer is retained if they | Typical period |
|---|---|---|
| Subscription or SaaS | Still have an active paid plan | Monthly or annual |
| Ecommerce | Placed another order within a window, such as 12 months | Quarterly or yearly |
| Marketplace | Transacted again, as buyer or seller | Monthly or quarterly |
| App or game | Opened the app after day 1, 7 or 30 | Daily, weekly, monthly |
| Education | Re-enrolled or progressed to the next course | Per term or year |
For apps, retention is commonly reported by day since install, such as day-1, day-7 and day-30 retention, and viewed as a cohort curve. Our guide to cohort analysis shows how to build one. For repeat buying, RFM analysis reveals which customers are drifting away.
Why retention matters
- Lower cost. You skip acquisition spend. See customer acquisition cost.
- Higher lifetime value. Longer relationships mean more orders. See customer lifetime value.
- Better predictability. Stable revenue from existing customers makes planning easier.
- Word of mouth. Satisfied long-term customers recommend you.
How to improve customer retention
- Find where customers leave. Compare retention by cohort, product, channel and first purchase. Look for the step where the curve drops.
- Fix the first experience. Good onboarding raises early retention. See customer onboarding.
- Listen. Use surveys such as NPS, CSAT and CES and act on complaints quickly.
- Stay in touch usefully. Relevant messages across email, WhatsApp, SMS and push, within consent. See customer engagement.
- Reward loyalty. Points, early access and recognition. See loyalty programs.
- Spot risk early. Identify customers whose activity is falling and reach out before they leave.
- Win back the lapsed. Run a respectful sequence. See win-back campaigns.
In Flowfox, you can build a segment of customers who have not ordered in 60 days with the segment builder, run a journey that sends a helpful reminder and then an offer if needed, and track the outcome in analytics. Our retention use case and churn use case pages show full flows, and retention strategies lists more ideas.
-- Retention for customers who ordered in Q1 and again in Q2
SELECT
  COUNT(DISTINCT q1.customer_id) AS q1_customers,
  COUNT(DISTINCT q2.customer_id) AS kept_in_q2,
  ROUND(100.0 * COUNT(DISTINCT q2.customer_id)
        / COUNT(DISTINCT q1.customer_id), 1) AS retention_pct
FROM orders q1
LEFT JOIN orders q2
  ON q2.customer_id = q1.customer_id
 AND q2.ordered_at >= '2026-04-01' AND q2.ordered_at < '2026-07-01'
WHERE q1.ordered_at >= '2026-01-01' AND q1.ordered_at < '2026-04-01';
This cohort style calculation avoids the need to separate new customers, because it follows one defined group over time. Adjust table and column names to your own schema.
What is a good retention rate?
There is no single figure. Retention varies widely by industry, price, purchase frequency and customer type. A grocery app and a yearly software contract cannot be compared. Judge your rate against your own history and against similar businesses, and focus on the trend. A rise of a few points, sustained, is worth far more than it sounds, because kept customers keep buying.
How to track retention over time
A single quarterly number hides a lot. To see what is really happening, group customers by the month they first bought and follow each group. If the January group keeps 60 percent after three months but the March group keeps only 48 percent, something changed, perhaps a different acquisition channel, a new product mix or a weaker welcome experience. Plot these groups as a table or a curve and look for where the lines flatten. A flat line means a loyal core has formed, and a line that keeps falling means the problem is deeper. Also segment retention by first product, by acquisition source and by city, since averages often hide one group that drags the total down.
Review the figure on a fixed schedule, monthly for fast-moving businesses and quarterly for slower ones, and write down what you changed each time so you can link actions to results. When you test a retention idea, such as a new onboarding series, keep a small holdout group that does not receive it. Without a comparison group, normal ups and downs can look like success. For more on measuring programmes see customer lifetime value and our guide to email marketing metrics.
Common mistakes
- Forgetting to subtract new customers. It overstates retention.
- Changing definitions. Compare like with like.
- Looking only at the average. Cohorts show where the real loss is.
- Ignoring revenue. Keep an eye on revenue retention too.
- Waiting until customers have left. Act on early warning signs.
The cheapest customer you will ever win is the one you already have.
Keep more of the customers you win. Spot risk early and follow up automatically across channels.
Read next: customer churn, consumer behavior and the blog.
Frequently asked questions
What is customer retention rate?
Customer retention rate is the percentage of existing customers who remain customers over a given period, such as a month, quarter or year.
What is the formula for customer retention rate?
Retention rate = ((customers at end − new customers) ÷ customers at start) × 100.
How is retention rate different from churn rate?
Churn rate is the share of customers who leave. Retention and churn add up to 100 percent for the same group and period.
What is a good customer retention rate?
It depends on industry, price and purchase frequency. Compare with your own history and similar businesses, and focus on steady improvement.
How do you calculate retention for ecommerce?
Define retained as ordering again within a window, such as 12 months, then divide the number of customers from the earlier period who ordered again by the number of customers in that period.
How can I improve customer retention?
Improve onboarding, listen to feedback, send relevant messages within consent, reward loyalty, spot at-risk customers early and run win-back campaigns.
Why is retention more important than acquisition?
Keeping customers usually costs less than winning new ones, increases lifetime value and makes revenue more predictable.