How do you know whether customers are happy? Asking works better than guessing, but which question? Three survey measures dominate: Net Promoter Score (NPS), Customer Satisfaction Score (CSAT) and Customer Effort Score (CES). They look similar, they measure different things, and teams often use the wrong one for the moment. This guide explains each, gives the formulas with worked examples, shows when to send which survey, how to read the results and how to act on feedback so people feel heard.
NPS, CSAT and CES at a glance
| Measure | Question it answers | Typical question | When to use |
|---|---|---|---|
| NPS | How loyal are customers overall? | How likely are you to recommend us to a friend or colleague? (0 to 10) | Quarterly or after key milestones |
| CSAT | How satisfied were they with a specific interaction? | How satisfied were you with your support today? (1 to 5) | Right after an event |
| CES | How easy was it to get something done? | The company made it easy for me to solve my problem (1 to 7 agree) | After support or a process step |
Net Promoter Score (NPS)
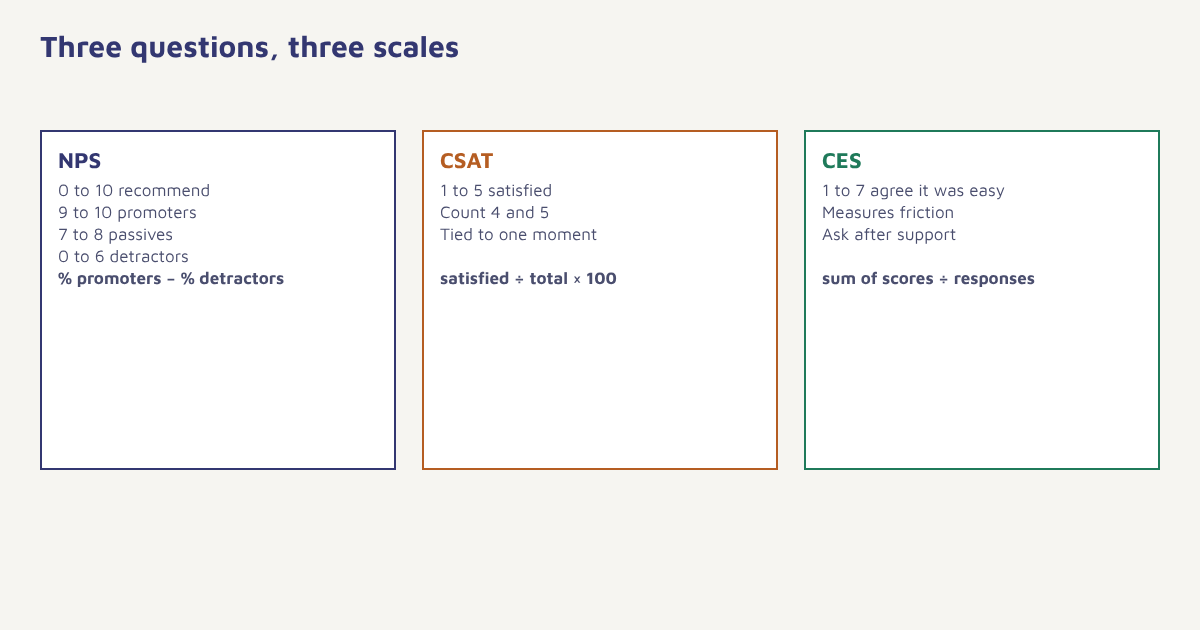
The Net Promoter Score was introduced by Fred Reichheld of Bain & Company. Customers answer one question on a scale of 0 to 10. Scores of 9 or 10 are promoters, 7 or 8 are passives and 0 to 6 are detractors. The score is the percentage of promoters minus the percentage of detractors, and it ranges from -100 to +100.
Formula. NPS = % promoters − % detractors
Example: out of 200 responses, 110 are promoters, 60 are passives and 30 are detractors. Promoters are 55 percent and detractors 15 percent, so NPS = 55 − 15 = 40. Passives do not count in the formula, but they are your best chance to improve the score.
These figures are an illustration of the arithmetic. NPS differs widely by industry, so compare your own trend over time and against similar businesses rather than against a universal target.
Customer Satisfaction Score (CSAT)
CSAT asks how satisfied a customer was with a particular product, order or interaction, usually on a 1 to 5 scale. The most common calculation counts the share of customers who chose the top two ratings (4 or 5).
Formula. CSAT (%) = (number of satisfied responses, 4 or 5 ÷ total responses) × 100
If 180 of 240 customers rate their delivery experience 4 or 5, CSAT is 180 ÷ 240 = 75 percent. CSAT is useful because it is tied to a specific moment, so you can compare channels, agents and journeys. Its weakness is that people who are mildly pleased and people who are delighted look the same.
Customer Effort Score (CES)
CES measures how easy it was for a customer to get what they wanted. It grew out of research suggesting that reducing effort does more for loyalty than trying to delight people. Customers rate a statement, usually on a 1 to 7 scale from strongly disagree to strongly agree. The result is reported as an average or as the percentage who agree.
Formula. CES = sum of all scores ÷ number of responses
With 50 responses summing to 300, the average CES is 6.0 on a 7-point scale, which suggests the process is easy. Use CES after support interactions, onboarding steps and returns, where friction matters most.
Which should you use?
| NPS | CSAT | CES | |
|---|---|---|---|
| Focus | Overall relationship | One interaction | Ease of a task |
| Predicts | Loyalty and referral | Short-term satisfaction | Repeat and churn risk after service |
| Frequency | Every few months | After each event | After each process step |
| Weakness | Not tied to an event | Does not show loyalty | Does not capture delight |
| Good for | Tracking health over time | Improving specific touchpoints | Fixing friction |
You do not have to pick one. A common pattern is NPS twice a year, CSAT after support tickets and deliveries, and CES after onboarding and returns.
How to run customer surveys that people answer
- Decide the decision it will inform. If no one will act on the answer, do not ask.
- Choose the right moment. Ask close to the experience, such as an hour after delivery or right after a chat closes.
- Use the right channel. Email suits detail, WhatsApp and SMS suit one-tap ratings, and in-app prompts suit product feedback.
- Keep it very short. One rating question and one optional open-text question.
- Make rating one tap. Buttons or links with the score built in raise response rates.
- Follow up. Contact detractors quickly, thank promoters and ask passives what would make it a ten.
- Close the loop. Tell people what changed because of feedback.
In Flowfox you can send a survey as a step in a journey, for example three days after delivery, and capture the score as an event on the customer profile. A low score can trigger an alert to your support team, and the answers feed segments such as “promoters who have not reviewed”. See WhatsApp and email for delivery options, and analytics for trends.
{
  "event": "nps_submitted",
  "contact_id": "c_8841",
  "properties": {
    "score": 9,
    "comment": "Fast delivery and easy returns",
    "survey_trigger": "delivered_plus_3_days",
    "channel": "whatsapp"
  }
}
Turning feedback into action
| Group | What they need | Action |
|---|---|---|
| Promoters (9 to 10) | Recognition and a path to advocate | Ask for a review or referral, offer early access |
| Passives (7 to 8) | A reason to feel more strongly | Ask what is missing, send helpful tips |
| Detractors (0 to 6) | To be heard quickly | Personal follow-up within a day, fix the issue, report back |
Segment results by channel, product, city and tenure. A stable overall number can hide a falling score in one group. Our guides to retention strategies and churn rate show how feedback connects to keeping customers.
Sample size, response bias and survey fatigue
A score is only as good as the people who answered. If 4 percent of customers reply, and mostly the angriest and the happiest do, the number describes those extremes, not your base. Look at the response rate next to every score, and compare like with like: the same channel, the same moment and a similar wording each time. Small samples swing wildly, so avoid reacting to a change of a few points from one week to the next. Watch trends over a quarter instead, and always read the free-text comments, which usually explain the number better than the number does.
The concept behind all three measures is customer satisfaction, which researchers have studied for decades, and the broader practice sits inside customer experience management. Neither means you need a research department. A single question after delivery, sent to every customer and tracked month on month, already tells you more than most dashboards. Add a quarterly NPS to see the relationship as a whole and cap surveys at one per customer every few weeks so that feedback stays welcome.
Common mistakes
- Surveying too often. Survey fatigue lowers response rates and goodwill.
- Asking leading questions. Keep wording neutral.
- Only reporting the average. Show the distribution and the comments.
- Ignoring low response bias. A score from 3 percent of customers may not represent the rest.
- Not following up. A survey that vanishes into a spreadsheet damages trust.
Feedback is only a measurement until someone acts on it. Then it becomes a relationship.
Collect feedback where customers already are. Trigger NPS, CSAT and CES surveys from events and route low scores to your team.
For more, read about customer retention and customer onboarding, and see more on the blog.
Frequently asked questions
What is the difference between NPS, CSAT and CES?
NPS measures overall loyalty by asking how likely customers are to recommend you. CSAT measures satisfaction with a specific interaction. CES measures how easy it was for the customer to get something done.
How do you calculate NPS?
Ask customers to rate likelihood to recommend from 0 to 10. Promoters score 9 or 10, detractors 0 to 6. NPS equals the percentage of promoters minus the percentage of detractors.
What is a good NPS score?
It depends on your industry. Scores above zero mean more promoters than detractors, and higher is better, but compare your own trend and similar businesses rather than a single universal target.
How do you calculate CSAT?
Divide the number of customers who gave a satisfied rating, usually 4 or 5 on a 5-point scale, by the total number of responses and multiply by 100.
When should I send a CES survey?
Right after an interaction where effort matters, such as a support ticket, onboarding step, return or checkout, so the experience is fresh.
How often should I send customer satisfaction surveys?
Send event-based CSAT and CES surveys after the relevant interaction, and NPS every few months. Avoid asking the same person too frequently.
What should I do with detractors?
Follow up quickly and personally, listen to the issue, fix what you can and tell them what changed. Detractors who are heard can often become loyal customers.