A customer sees an Instagram ad on Monday, opens your newsletter on Wednesday, clicks a WhatsApp reminder on Friday and buys. Which of those deserves the credit? Marketing attribution is the attempt to answer that question with something better than a shrug. The answer shapes where the next rupee of budget goes, so a poor model quietly steers spending toward the wrong channels. This guide explains what attribution is, walks through the main models with the same example, shows what each model hides, covers the practical problems of tracking across channels and gives a simple way to choose a model and sanity-check it.
What is marketing attribution?
Marketing attribution assigns credit for a conversion, such as a purchase or sign-up, to the marketing touchpoints that came before it. A touchpoint is any interaction: an ad click, an email open, a push tap, a visit from search, a chat with support. The sequence of touchpoints for one customer is their path to conversion. Attribution models are rules, or statistical methods, for splitting the credit along that path. None of them reveals the truth about why someone bought. They are lenses, each of which brightens some touchpoints and dims others.
The main attribution models
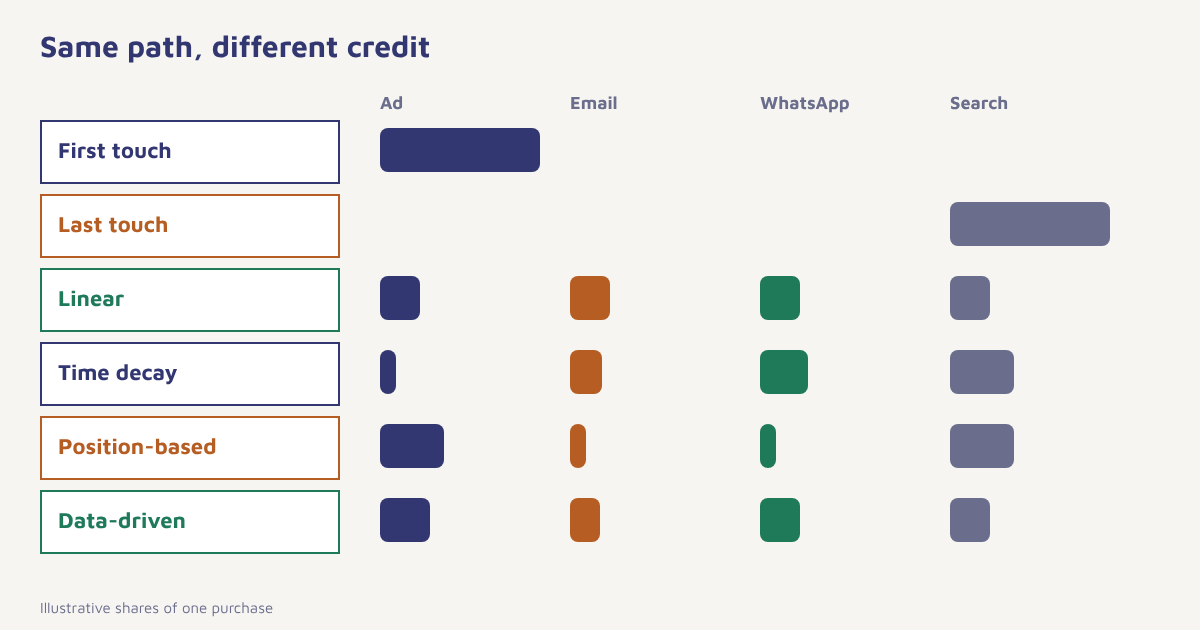
Use one customer path throughout: Instagram ad, then email, then WhatsApp reminder, then branded search, then purchase. Here is how each model splits 100 percent of the credit.
| Model | Rule | Credit in the example | Favours |
|---|---|---|---|
| First touch | All credit to the first interaction | Instagram ad 100% | Discovery channels |
| Last touch | All credit to the final interaction before purchase | Branded search 100% | Closing channels |
| Linear | Equal credit to every touchpoint | 25% each | Long, multi-step journeys |
| Time decay | More credit to touches nearer the purchase | Ad 10%, email 20%, WhatsApp 30%, search 40% | Short sales cycles |
| Position-based (U-shaped) | 40% to first, 40% to last, 20% shared by the middle | Ad 40%, email 10%, WhatsApp 10%, search 40% | Discovery plus close |
| Data-driven | Statistical model of what each touch adds | Depends on your data | Large volumes of paths |
The percentages are illustrative: time-decay weights vary by tool. Notice that the same purchase makes the Instagram ad worth anything from zero to everything, depending on the model. That is not a flaw in your analytics. It tells you the question has no single right answer.
What each model hides
| What it gets right | What it hides | |
|---|---|---|
| First touch | Shows what starts relationships | Ignores everything that nurtured the customer |
| Last touch | Easy to measure and audit | Over-credits search and retargeting that harvest demand others created |
| Linear | Respects the whole journey | Treats a banner impression like a sales call |
| Time decay | Fits impulse and short-cycle buying | Undervalues early awareness work |
| Position-based | Balances opening and closing | Fixed weights are arbitrary |
| Data-driven | Learns from real paths | Needs volume, is hard to explain, and still sees only tracked touches |
Rule of thumb. If a channel looks great under last touch and terrible under first touch, it probably closes sales other channels started. Cutting the starters will eventually starve it too.
Why attribution is harder across email, WhatsApp, SMS and push
Tracking a web ad click is relatively mature. Messaging channels bring extra problems.
- Opens are unreliable. Privacy features pre-load email images, so an “open” may not be a person. Clicks and conversions are steadier evidence. See email marketing metrics.
- Identity breaks. A visitor on a phone browser and the same person on a laptop look like two people unless you link them with a login or contact ID. See the customer data platform guide.
- Dark touchpoints. A friend’s recommendation or a shop visit leaves no digital trail.
- Consent limits tracking. If someone declines tracking, you may not see their path. Respect that. Read the DPDP Act guide for the rules in India.
- Overlap. Email, push and WhatsApp reminders often fire close together, so each claims the same sale.
In Flowfox, every message sent, delivered, clicked and converted lands as an event on the same contact profile, so a path across email, WhatsApp, SMS and push can be read in one place. The analytics view reports conversions by campaign and channel, and the data model explains how events and conversions are tied to the contact. Even so, treat any dashboard credit as an estimate.
Beyond rules: incrementality and holdouts
Attribution describes who touched the customer. It does not prove who caused the sale. A shopper who was going to buy anyway may click your reminder on the way. The way to measure cause is an experiment. Hold out a random slice of customers who do not receive a message, and compare their conversion rate with the group who did. The gap is the incremental effect. Holdouts are simple to run for lifecycle messages such as cart reminders and win-back sequences, and they often show that a channel with excellent attributed revenue adds less than the report suggests. Our guide to A/B testing covers the mechanics, and abandoned cart recovery is a good place to start.
How to choose and use a model
- Describe your buying cycle. A tea subscription bought on impulse is not a car loan researched over weeks.
- Pick a primary model and a comparison model. For many businesses, position-based plus last touch is a workable pair.
- Fix the lookback window. Decide how many days of earlier touches can earn credit, such as 7, 14 or 30, and keep it constant.
- Unify identity. Link anonymous visits to contacts when people log in or give an email or phone number.
- Tag every link. Use consistent campaign parameters so sources are not lumped into “direct”.
- Compare models side by side. Where two models disagree sharply, investigate before moving budget.
- Validate with a holdout. Test one channel at a time and trust the experiment over the model.
-- Position-based credit (40/20/40) per order, illustrative schema
WITH paths AS (
  SELECT order_id, channel,
         ROW_NUMBER() OVER (PARTITION BY order_id ORDER BY touched_at) AS pos,
         COUNT(*)     OVER (PARTITION BY order_id)                     AS n
  FROM touchpoints
  WHERE touched_at >= order_time - INTERVAL 30 DAY
)
SELECT channel,
  SUM(CASE WHEN n = 1 THEN 1.0
           WHEN pos = 1 OR pos = n THEN 0.4 + IF(n = 2, 0.1, 0)
           ELSE 0.2 / (n - 2) END) AS credited_orders
FROM paths
GROUP BY channel;
The query above is a sketch to show the logic. Adjust table and column names to your own schema, and check it against a few orders by hand.
A worked example (invented numbers)
A home-décor store spends ₹1,00,000 a month: ₹50,000 on social ads, ₹20,000 on search ads and ₹30,000 on its email and WhatsApp programme. Under last touch, search is credited with 300 orders, email and WhatsApp with 220, and social with 80. Search looks like the star and social looks like waste. Under position-based credit, social rises to 210 orders and search falls to 190. The owner is tempted to cut social after reading the first report. Instead the team runs a four-week test in which one city sees no social ads. Search orders in that city fall by about a third, which shows social was feeding search. The final plan trims search retargeting a little and keeps social. The shop, figures and test result are made up to show the reasoning, not a benchmark.
Common mistakes
- Treating the model as truth. It is a convention.
- Judging channels on last touch only. You will starve the top of the funnel.
- Changing models mid-year. Trends become uninterpretable.
- Counting the same sale twice. Check that channel totals do not exceed real orders.
- Ignoring offline and word of mouth. Ask buyers “how did you hear about us?” at checkout.
Attribution tells you who was in the room. Only an experiment tells you who made the sale.
See the whole customer path. Track every message and conversion on one profile, then test what really works.
Read next: marketing ROI, conversion rate optimization and the blog. For the background of the field, see the overview of marketing mix modeling, which uses aggregate data when individual paths cannot be tracked.
Frequently asked questions
What is marketing attribution?
Marketing attribution assigns credit for a conversion to the marketing touchpoints that came before it, using a model or rule to split that credit.
What are the main attribution models?
The common ones are first touch, last touch, linear, time decay, position-based and data-driven. Each gives different credit to the same customer path.
Which attribution model is best?
There is no best model. Choose one that fits your buying cycle, compare it with a second model and validate important decisions with holdout tests.
What is the difference between attribution and incrementality?
Attribution assigns credit to touchpoints that preceded a sale. Incrementality measures how many extra sales a channel caused, usually through a holdout experiment.
Why is last-touch attribution misleading?
It gives all credit to the final interaction, so channels that close sales, like branded search and retargeting, look better than channels that started the journey.
How do I track attribution across email, WhatsApp and SMS?
Link activity to one contact profile, tag every link consistently, rely on clicks and conversions rather than opens, and respect consent for tracking.
What is a lookback window?
A lookback window is the number of days before a conversion in which touchpoints can earn credit, for example 7, 14 or 30 days.