
Every marketing budget eventually meets the same question from finance: what did we get for it? Marketing ROI is the number meant to answer that. It sounds simple, spend versus return, yet it is easy to calculate in a way that flatters the campaign or hides what really happened. This guide gives the marketing ROI formula, shows a worked example in rupees, explains the difference between ROI, ROAS and payback, covers what to count as cost and return, shows how to measure ROI for email, WhatsApp, SMS and push, and lists the traps that make ROI figures misleading.
What is marketing ROI?
Return on investment compares the profit a marketing activity generates with what it cost. Expressed as a percentage, it tells you how many rupees of profit you earn for each rupee spent. An ROI of 100 percent means you earned back the cost and an equal amount on top. Zero means you broke even. Negative means you lost money. Because it works on profit rather than revenue, it is stricter than a simple revenue-per-spend ratio.
The marketing ROI formula
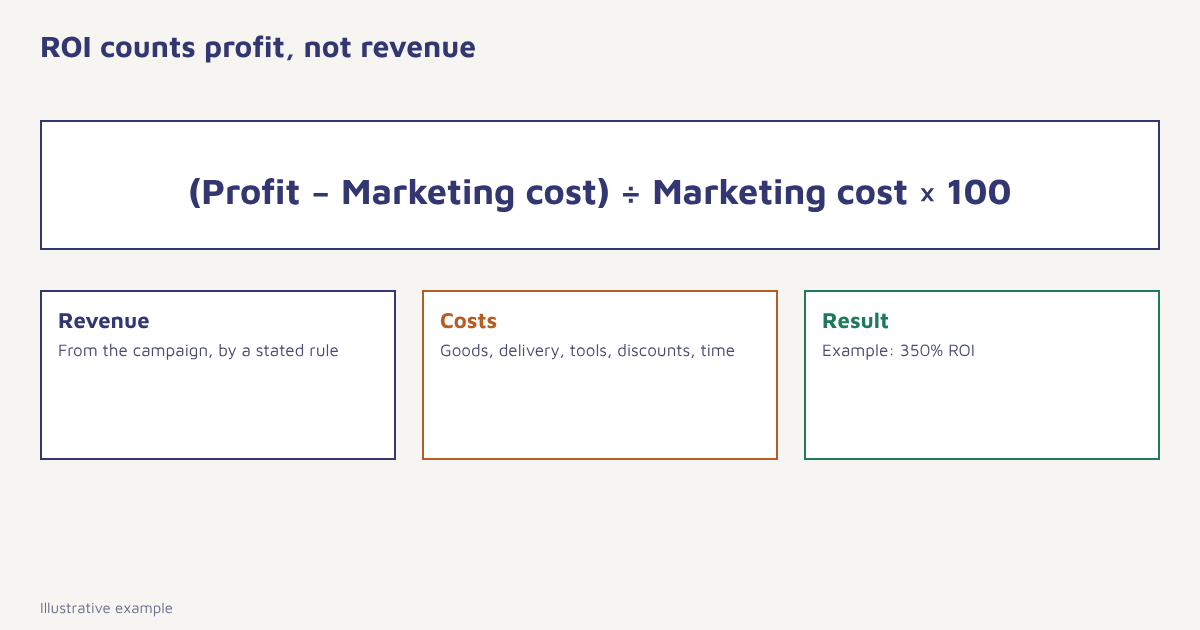
Formula. Marketing ROI (%) = ((Revenue from marketing − Cost of goods and delivery − Marketing cost) ÷ Marketing cost) × 100
A simpler version, ROI = (revenue − marketing cost) ÷ marketing cost, is common but overstates the return because it ignores the cost of making and delivering what you sold. Use the profit version for real decisions.
A worked example (invented numbers)
| Line | Amount |
|---|---|
| Revenue from the Diwali email and WhatsApp campaign | ₹6,00,000 |
| Cost of goods, packing and delivery on those orders | ₹3,30,000 |
| Gross profit before marketing | ₹2,70,000 |
| Marketing cost (platform share, design, messaging fees, discount value) | ₹60,000 |
| Net profit after marketing | ₹2,10,000 |
| ROI | (2,10,000 ÷ 60,000) × 100 = 350% |
The simple version would have read (6,00,000 − 60,000) ÷ 60,000 = 900 percent, nearly three times as high. That is the danger of leaving costs out. The store and figures are invented for illustration.
ROI, ROAS, CAC and payback
| Measure | Formula | Question it answers | Weakness |
|---|---|---|---|
| ROI | (Profit − cost) ÷ cost | Was it profitable, and by how much? | Needs profit data and agreed attribution |
| ROAS (return on ad spend) | Revenue ÷ ad spend | How much revenue per rupee of ads? | Ignores product cost and margin |
| CAC | Marketing cost ÷ new customers | What does a customer cost to win? | Says nothing about their value. See CAC |
| LTV : CAC | Lifetime value ÷ CAC | Is a customer worth what we pay? | Depends on a lifetime estimate. See CLV |
| Payback period | Months until a customer repays their CAC | How quickly does cash come back? | Ignores later profit |
A campaign can have a high ROAS and a poor ROI if margins are thin, and a modest first-order ROI but an excellent long-term one if customers come back. That is why single-campaign ROI is best read together with retention. See customer retention rate.
What to count
Costs
- Tool and platform fees, or your share of them
- Messaging costs for SMS, WhatsApp, RCS and email sending
- Creative, copy, photography and design time
- Discounts and free gifts you gave away
- Agency and freelance fees
- Internal staff time, at least roughly
Returns
- Revenue from orders that the campaign influenced, using a stated attribution rule
- Gross profit on those orders, after goods, packing, payment fees and delivery
- Optionally, an estimate of future profit from the new customers won
Be wary of returns you cannot trace. Revenue credited to a campaign may include sales that would have happened anyway. The clean way to check is a holdout group: leave a random slice of customers out of the campaign and compare. Our guide to attribution models explains why, and A/B testing covers the setup.
ROI by channel
Each channel has its own cost structure, which changes how you read ROI.
| Channel | Main costs | Notes |
|---|---|---|
| Platform fee, content, discounts | Low cost per send, so ROI is often high, but check deliverability. See email marketing | |
| Per-conversation fees, template approval, agent time | Higher cost per message, high intent. See WhatsApp marketing | |
| SMS | Per-message fees, DLT registration | Predictable cost, short messages. See SMS marketing |
| Push | Platform fee, content | Very low cost per message, depends on opt-in. See push notifications |
| Paid ads | Media spend, creative | Easy to measure spend, hard to measure incrementality |
Comparing channels by cost per order or profit per message is often more useful than comparing headline ROI, because a small high-ROI channel cannot absorb a large budget. In Flowfox, analytics reports conversions and revenue per campaign and channel, campaigns and journeys record what was sent and to whom and the order events provide the revenue side. Add your cost lines in a spreadsheet to finish the calculation.
# Spreadsheet version
Gross profit      =B2-B3          (revenue minus goods and delivery)
Net profit        =B4-B5          (gross profit minus marketing cost)
ROI %             =B6/B5*100
Cost per order    =B5/B7
Profit per message=B6/B8
How to measure ROI for a campaign
- Define the goal and period. Orders, sign-ups or reactivations, over a fixed window such as 14 days after the send.
- Agree the attribution rule. Write it down before the campaign, not after.
- Add up every cost. Include discounts and staff time, not just platform fees.
- Measure revenue and margin. Use gross profit, not revenue.
- Compare with a holdout. Count only the lift above the control group where you can.
- Calculate ROI and payback. Show both, and note any assumptions.
- Record and reuse. Keep a simple log so next quarter’s plan starts from evidence.
Traps that distort ROI
- Revenue instead of profit. It makes every campaign look good.
- Short windows for long-cycle products. You miss later sales.
- Long windows for impulse products. You take credit for unrelated sales.
- Ignoring discount cost. A 20 percent coupon is a real cost.
- Cherry-picking the best campaign. Report the average and the range.
- Forgetting brand and retention effects. Some value cannot be traced to one order. Say so rather than inventing a number.
How to report ROI so people trust it
A number that nobody believes is worse than no number. Show the working: revenue, margin, each cost line, the attribution rule and the window, all on one page. Give a range where the data is uncertain, for instance “ROI between 250 and 350 percent depending on whether we count orders within 7 or 14 days”. Report the campaigns that did badly as well as the stars, so the average is honest. Agree with finance in advance on which costs belong, because disagreements about definitions after the fact feel like excuses. Over time, a steady log of results lets you see which kinds of campaign repay their cost, which is more useful than the headline of any single send.
Remember also that ROI favours small, cheap activities, since a tiny cost can produce a huge percentage. A cart-reminder email may show an ROI in the thousands, while a brand campaign shows little, yet you cannot run a business on cart reminders alone because their volume is limited. Look at absolute profit as well as the percentage, and use the percentage to rank where to add budget first. For ideas on balancing short-term returns with long-term growth, see the discussion of the marketing mix, and the leading and lagging indicators guide for how to track early signals while the profit figures catch up.
Common mistakes
- Reporting only ROAS. Revenue per ad rupee is not profit.
- Judging email by opens. Judge it by profit.
- No baseline. Without a control, you cannot tell lift from habit.
- Changing the formula between reports. Keep definitions stable.
If you cannot say what a rupee of marketing earned, you are guessing with a budget.
Connect sends to sales. Track campaign revenue and conversions on the customer profile.
Read next: average order value, customer acquisition cost and the blog. For general background on measuring marketing performance, see marketing effectiveness.
Frequently asked questions
What is marketing ROI?
Marketing ROI compares the profit generated by marketing with its cost, expressed as a percentage of the cost.
What is the formula for marketing ROI?
Marketing ROI = ((revenue from marketing minus cost of goods and delivery minus marketing cost) divided by marketing cost) times 100.
What is the difference between ROI and ROAS?
ROAS is revenue divided by ad spend and ignores product cost. ROI uses profit, so it shows whether the activity actually made money.
What is a good marketing ROI?
It depends on margins, industry and growth stage. Compare against your own history and your cost of capital, and read ROI together with payback and retention.
How do I measure ROI for email and WhatsApp campaigns?
Add up all costs, including messaging fees and discounts, measure gross profit from attributed orders in a fixed window, and compare with a holdout group where possible.
Why does my reported ROI look too high?
Common causes are using revenue instead of profit, leaving out costs such as discounts, and crediting sales that would have happened anyway.
Should I include staff time in marketing ROI?
Ideally yes, at least approximately, because leaving it out overstates returns, especially for small campaigns that take a lot of effort.