Two online stores can have the same number of orders and very different businesses. If one customer typically spends ₹900 and another ₹1,600, the second store earns far more from the same traffic, the same ad budget and the same delivery runs. That is why average order value, or AOV, is one of the first numbers an ecommerce team learns and one of the cheapest to improve. This guide gives the formula, a worked example, the levers that raise AOV honestly, how to use email, WhatsApp, SMS and push to support them and the cautions that stop AOV from becoming a misleading target.
What is average order value?
Average order value is the average amount customers spend each time they place an order. It is a basic ecommerce metric, described alongside other retail measures in the article on average transaction value. It matters because revenue is the product of orders and value per order. If you cannot easily get more orders, you can look for more value in each one. It also affects your unit economics, since fixed costs such as packing, payment fees and delivery are spread over a larger basket.
The AOV formula
Formula. Average order value = Total revenue ÷ Number of orders (in the same period)
| Month | Revenue | Orders | AOV |
|---|---|---|---|
| August | ₹12,60,000 | 1,400 | ₹900 |
| September | ₹14,30,000 | 1,430 | ₹1,000 |
| October | ₹18,40,000 | 1,600 | ₹1,150 |
The figures are invented to show the arithmetic. Use net revenue after returns and cancellations where you can, and state whether tax and shipping are included, so that the number stays comparable over time.
Eight honest ways to raise AOV
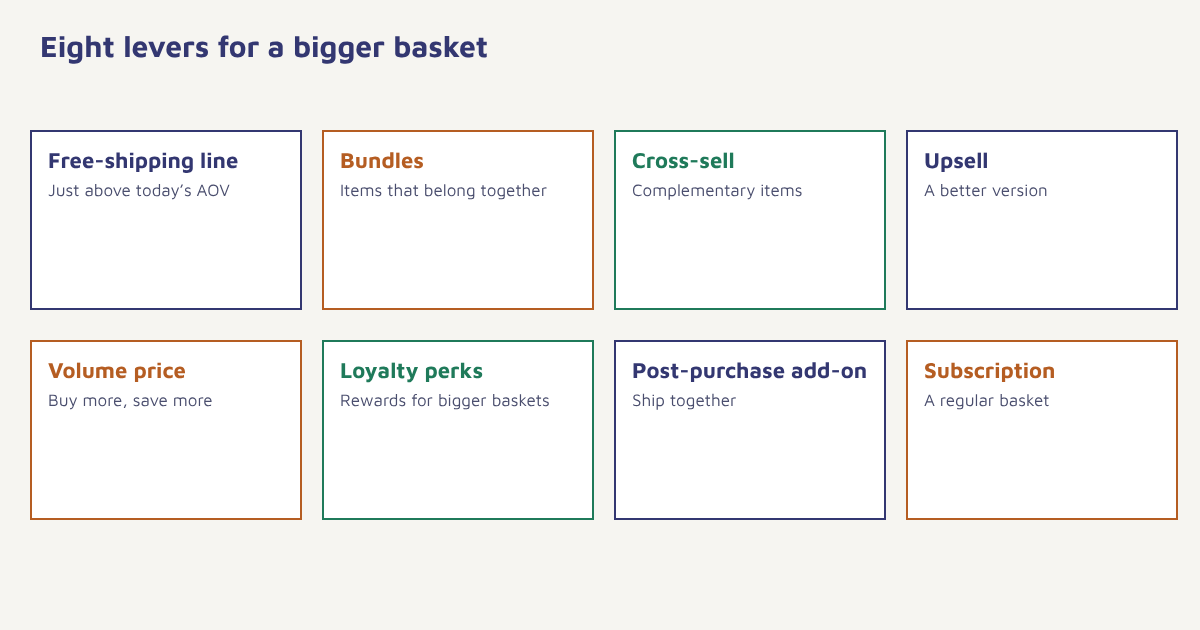
| Lever | How it works | Example |
|---|---|---|
| Free-shipping threshold | Customers add items to reach a set amount | Free delivery above ₹999 |
| Bundles | Related items sold together at a small saving | Skincare routine of three products |
| Cross-selling | Suggest complementary items. See cross-selling and upselling | Case with a phone |
| Upselling | Offer a better version | Larger pack or premium model |
| Volume pricing | A lower unit price for more units | Buy 3, save 10% |
| Loyalty rewards | Points or perks for larger baskets. See loyalty programs | Double points above ₹2,000 |
| Post-purchase offers | Add-on after checkout, shipped together | Gift wrap or refill |
| Subscriptions | Regular delivery of a basket | Monthly coffee box |
Set the free-shipping threshold slightly above your current AOV, perhaps 15 to 30 percent higher, so that it is reachable but encouraging. Test the level rather than guessing, using A/B testing. Choose bundles customers would genuinely buy together, since forcing unrelated items together raises returns, not satisfaction.
Using messages to lift AOV
| Moment | Message | Channel |
|---|---|---|
| Cart is below the free-shipping threshold | “Add ₹180 more for free delivery” with two suggested items | On-site banner, push, email |
| After purchase | Complementary items based on what was bought. See product recommendations | Email, WhatsApp |
| Replenishment time | Reminder with a bundle or multi-pack option | Email, WhatsApp, SMS |
| Festival or sale | Tiered offers: more spend, more reward. See festival campaigns | All channels, within consent |
| Abandoned cart | Reminder with an added incentive for a larger basket. See cart recovery | Email, WhatsApp |
In Flowfox, the segment builder can find customers whose carts sit just under your free-shipping line, or whose past orders show a pattern of buying accessories. A journey then sends a tailored suggestion through email, WhatsApp or push, and analytics tracks the AOV of those who received it against a holdout group. See also the ecommerce solution page.
Look at AOV by segment, not only overall
A single average hides a lot. A few large orders can pull it up while most customers spend little. Split AOV by new and returning customers, by acquisition channel, by device, by first product category and by city. Compare the median order value with the average: if the median is much lower, a small group of big spenders is carrying the figure. Segments with unusually low AOV are candidates for bundles or thresholds. Segments with high AOV may deserve loyalty perks. Our guides to behavioral segmentation and RFM analysis show how to find these groups.
-- AOV and median-ish view by month and channel (illustrative schema)
SELECT DATE_FORMAT(ordered_at, '%Y-%m') AS month,
       acquisition_channel,
       COUNT(*)                         AS orders,
       ROUND(SUM(net_amount) / COUNT(*), 0) AS aov
FROM orders
WHERE status = 'delivered'
GROUP BY month, acquisition_channel
ORDER BY month, aov DESC;
A plan to raise AOV
- Measure the baseline. AOV and median order value for the last three months, by segment.
- Study the baskets. Which items are often bought together? Which orders sit just under your shipping line?
- Choose two levers. For example a free-shipping threshold and post-purchase suggestions.
- Set up the messages. On-site prompts and automated follow-ups for the right segments.
- Test against a control. Leave a random group on the old experience for a few weeks.
- Watch the side effects. Check conversion rate, returns and satisfaction as well as AOV.
- Keep what works. Retest thresholds each quarter, since prices and habits change.
Cautions: AOV is not the goal
Pushing AOV alone can backfire. If a higher free-shipping threshold lowers the share of visitors who buy, total revenue may fall even as AOV rises. Check conversion rate alongside it, and read about cross-selling for the sales side of the same idea. Aggressive upselling can lead to returns and complaints, which cost money and trust. And a rising AOV driven by discounts on large baskets may reduce margin per order. The healthiest approach is to track profit per order, not only revenue per order, as covered in the guide to marketing ROI. For the effect on long-term value, see customer lifetime value and repeat purchase rate.
A worked example (invented numbers)
A tea seller has an AOV of ₹780 and a free-shipping line at ₹500, which almost every order already clears, so it motivates nobody. The team moves the threshold to ₹899 and adds a “you are ₹120 away from free delivery” banner with two sample-pack suggestions. It also adds a three-tin bundle at a 10 percent saving. Over six weeks, with 20 percent of visitors held back on the old setup as a control, the test group’s AOV rises to ₹905 and conversion falls slightly from 3.1 to 3.0 percent. Revenue per visitor is about 4 percent higher in the test group. The seller keeps the change but watches returns on the bundle. The business, results and figures are made up to show the method, not a benchmark.
Reading AOV alongside other numbers
AOV rarely moves alone. A new promotion may bring many first-time buyers who spend little, pulling the average down while revenue and customer count climb. A festival sale may push AOV up while repeat buying drops afterwards. To avoid misreading these swings, view AOV next to orders, new versus returning customers, conversion rate and return rate. If AOV rises and orders fall by a similar share, nothing has improved. If AOV rises and orders hold steady, you have found real value. A short weekly table with these five figures gives the team a shared picture, and a note on what changed that week makes later reviews far easier.
It also helps to know where your AOV sits relative to your costs. If delivery and packing cost ₹120 per order and your average gross profit per order is ₹260, then a free-shipping threshold that raises the basket by ₹150 may be worth it, while one that costs you a conversion may not. Work these numbers out before you launch the offer. The concept of a basket and its economics is a familiar one in retail, and the background is covered under market basket analysis, a technique for finding which items customers buy together. For a plain-language view of how pricing choices affect what customers buy, see the overview of price elasticity of demand. Both are useful for deciding which bundles and thresholds to test first.
Common mistakes
- Setting the threshold by guesswork. Test it.
- Ignoring margin. Bigger baskets with deep discounts can earn less.
- Showing irrelevant add-ons. Relevance beats volume.
- Looking only at the average. Check the median and the segments.
- Forgetting returns. Count net revenue.
A bigger basket is only a win if the customer is glad they filled it.
Suggest the right add-on at the right moment. Segment by basket behavior and follow up across channels.
Read next: cross-selling and upselling, product recommendation engines and the blog.
Frequently asked questions
What is average order value?
Average order value is the average amount customers spend per order, calculated as total revenue divided by the number of orders in the same period.
How do you calculate AOV?
Divide total revenue by the number of orders for the period. For example, ₹18,40,000 from 1,600 orders gives an AOV of ₹1,150.
How can I increase average order value?
Use free-shipping thresholds, bundles, cross-selling, upselling, volume pricing, loyalty rewards, post-purchase offers and subscriptions, and test each one.
What is a good average order value?
It varies by industry and product price. Compare with your own history and similar businesses, and read it together with conversion rate and margin.
Is a higher AOV always better?
No. If higher AOV lowers conversion, raises returns or depends on heavy discounts, profit may fall even though the average rises.
What is the difference between AOV and customer lifetime value?
AOV is the average value of a single order. Customer lifetime value is the total value a customer brings over the whole relationship.
How do I set a free-shipping threshold?
Start slightly above your current AOV, often by 15 to 30 percent, then test different levels against a control group and watch conversion and margin.