Winning a first order is the expensive part of ecommerce. Whether the business is healthy depends on what happens next: do customers come back? Repeat purchase rate is the plainest measure of that. It is easy to calculate, easy to explain to a team and very revealing, because a store that wins thousands of first-time buyers but few second orders is quietly burning its acquisition budget. This guide gives the formula, a worked example, the related measures that people mix up with it, the typical repeat cycle for different products and the lifecycle messages that move the number.
What is repeat purchase rate?
Repeat purchase rate, sometimes called repeat customer rate, is the share of customers who have bought more than once within a chosen period. It is a close relative of customer retention but not the same: retention asks whether customers stay, while repeat purchase rate asks whether they buy again. For businesses that sell goods rather than subscriptions, it is often the most practical stand-in for loyalty.
The formula
Formula. Repeat purchase rate (%) = (Customers who ordered two or more times ÷ Total customers who ordered) × 100, within the same period
| Quantity | Value |
|---|---|
| Customers who ordered in the last 12 months | 8,000 |
| Of them, customers with two or more orders | 2,200 |
| Repeat purchase rate | (2,200 ÷ 8,000) × 100 = 27.5% |
| Customers with exactly one order | 5,800 (72.5% one-time) |
The figures are invented to show the arithmetic. Always state the period and whether you count customers or orders, since the answer changes with both.
Measures people confuse with it
| Measure | What it counts | How it differs |
|---|---|---|
| Repeat purchase rate | Share of customers with 2 or more orders in a period | The headline loyalty measure for goods |
| Customer retention rate | Share of customers kept over a period. See retention rate | Based on staying active, not necessarily buying |
| Purchase frequency | Orders ÷ customers over a period | An average, so a few heavy buyers can distort it |
| Time between orders | Days from one order to the next | Tells you when to remind |
| Second-order rate | Share of first-time buyers who buy again within a set window | The sharpest early signal |
| Churn rate | Share of customers who leave. See churn rate | The opposite view |
Know your natural repeat cycle
No product is bought at the same rhythm. Coffee, skincare refills and pet food run in weeks. Clothes run in seasons. Furniture runs in years, so a 12-month repeat rate there will look low whatever you do. Measure the gap between first and second orders for your own customers, and use the median of that gap to time reminders and to pick a sensible window for the metric.
| Product type | Typical rhythm (varies) | Better window to measure |
|---|---|---|
| Groceries, tea, coffee, pet food | Weeks | 60 to 90 days |
| Beauty and personal care | 1 to 3 months | 90 to 180 days |
| Fashion | Seasonal | 6 to 12 months |
| Electronics, furniture | Years | 24 months or more, or measure accessories |
| Gifting | Around festivals | Year over year |
These rhythms are rough guides, not benchmarks. Your own order data is the only reliable source.
-- Share of first-time buyers in Q1 who bought again within 90 days
WITH first_orders AS (
  SELECT customer_id, MIN(ordered_at) AS first_at
  FROM orders GROUP BY customer_id
)
SELECT
  COUNT(*)                                          AS new_customers,
  SUM(EXISTS (SELECT 1 FROM orders o
              WHERE o.customer_id = f.customer_id
                AND o.ordered_at > f.first_at
                AND o.ordered_at <= f.first_at + INTERVAL 90 DAY)) AS repeaters,
  ROUND(100 * SUM(EXISTS (SELECT 1 FROM orders o
              WHERE o.customer_id = f.customer_id
                AND o.ordered_at > f.first_at
                AND o.ordered_at <= f.first_at + INTERVAL 90 DAY)) / COUNT(*), 1) AS second_order_rate_pct
FROM first_orders f
WHERE f.first_at >= '2026-01-01' AND f.first_at < '2026-04-01';
This is a sketch for MySQL. Adjust names to your schema and check a few customers by hand. Following the same group of first-time buyers forward is the cohort method, explained in our cohort analysis guide.
How to raise repeat purchase rate
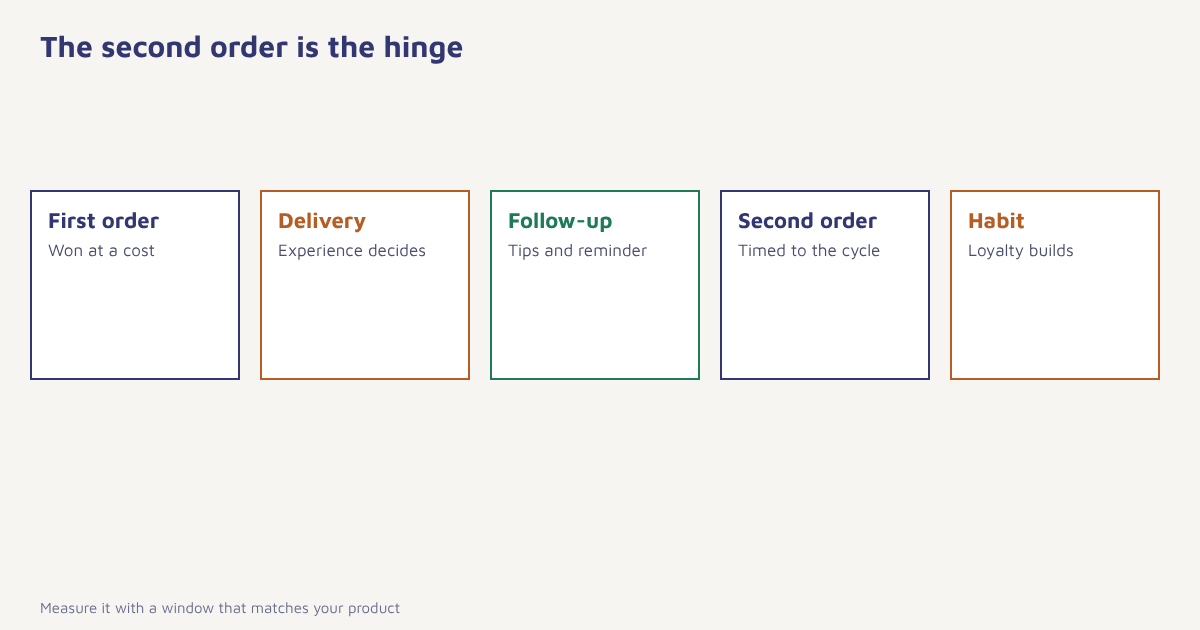
- Fix the first experience. Delivery on time, correct items, clear packaging. A bad first order rarely leads to a second.
- Send a thoughtful welcome and post-purchase series. Usage tips, care guides and a review request. See the welcome email series.
- Time a reminder to the natural cycle. Send a reorder nudge a few days before the typical gap runs out.
- Recommend the next item. Suggest complementary products based on the first order. See product recommendations.
- Reward the second order. A small incentive or early access for returning customers. See loyalty programs.
- Offer easy reordering. One-tap reorder links and saved details.
- Win back the lapsed. A respectful sequence for those who pass their usual gap. See win-back campaigns.
In Flowfox, a journey can start at the delivery event, wait for the typical reorder gap, check that the customer has not already ordered and then send a reminder on the channel they respond to, whether email, WhatsApp, SMS or push. The segment builder finds one-time buyers past their gap, and analytics compares second-order rates for those who received the series against a holdout. See also the retention use case and the broader list of retention strategies.
Segment the repeat rate
An overall number hides the stories. Break repeat purchase rate down by first product, acquisition channel, discount used on the first order, city and delivery speed. Customers who arrived through a deep-discount campaign often repeat less than those who arrived through organic search or referrals. Customers whose first order was delayed often repeat less. Those patterns tell you where to spend acquisition money and which operational problems cost you the second order. Related reading: behavioral segmentation and customer lifetime value, since repeat buyers are where lifetime value grows.
A worked example (invented numbers)
A pet-food shop sees a 12-month repeat rate of 31 percent, but a second-order rate within 60 days of only 14 percent. Its bags last about five weeks, so many first-time buyers run out and buy elsewhere. The team adds a reminder at day 28 with a one-tap reorder link, a small saving on a second bag and a note about feeding amounts. It holds back 15 percent of new customers as a control. After two months, the test group’s 60-day second-order rate is 21 percent against 14 percent for the control. The shop and figures are made up to show the method. In practice, check that the lift holds for more than one cohort before assuming it.
Why customers do not come back
Before designing reminders, find out why one-time buyers stopped. Ask them. A short, friendly survey a few weeks after the first delivery, or a reply-to address in the follow-up email, will surface themes quickly: the product did not match the photos, the delivery was late, the price felt high for a second purchase, they simply forgot, or they found a rival. Each reason calls for a different response. Forgetting is solved with a reminder. A mismatch is solved by better product pages and sizing help. A price problem may need a smaller pack or a subscription. A late delivery needs an operations fix that no email can replace. The practice of closing the loop with customers is covered in our guide to the customer feedback loop.
Look at the data too. Compare the first orders of customers who came back with those who did not: which product, which discount, which delivery time, which channel. Patterns usually appear fast. If customers whose first order was delivered within two days repeat at twice the rate of those who waited a week, a delivery improvement may lift repeat rate more than any message. For a wider view of how loyalty forms, the article on brand loyalty gives a useful overview, and our customer engagement guide explains how to keep the conversation going between purchases without overwhelming people.
Common mistakes
- Comparing different windows. A 90-day and a 12-month rate are not comparable.
- Ignoring one-time buyers’ reasons. Ask them why they did not return.
- Over-discounting to force a second order. It can train customers to wait for sales.
- Treating all products alike. Cycles differ.
- Counting orders instead of customers. One loyal buyer can hide many one-timers.
The second order is when a customer stops being a campaign result and starts being a relationship.
Win the second order. Time reminders to each customer’s natural cycle and prove the lift.
Read next: average order value, customer feedback loops and the blog. For background on the wider idea, see repeat customers and customer lifetime value.
Frequently asked questions
What is repeat purchase rate?
Repeat purchase rate is the share of customers who have bought more than once within a chosen period.
How do you calculate repeat purchase rate?
Divide the number of customers with two or more orders by the total number of customers who ordered in the same period, then multiply by 100.
What is a good repeat purchase rate?
It depends heavily on the product and purchase cycle. Compare with your own history, measure over a window that matches your natural reorder gap and watch the trend.
What is the difference between repeat purchase rate and retention rate?
Repeat purchase rate counts customers who bought again. Retention rate counts customers who stayed active or subscribed, which may not require a purchase in every period.
How can I increase repeat purchases?
Fix the first experience, follow up after delivery, time reminders to the natural cycle, recommend the next product, reward the second order and win back lapsed customers.
What is second-order rate?
Second-order rate is the share of first-time buyers who place another order within a set window, such as 60 or 90 days. It is a sharp early signal of loyalty.
How do I find my natural repeat cycle?
Calculate the days between first and second orders for repeat customers and use the median to time reminders and choose a measuring window.