One question, a scale from 0 to 10 and a simple subtraction: that is how net promoter score became one of the most widely used customer measures. It is also one of the most misused. Teams report a single number, celebrate or panic, and never talk to the people who gave the scores. This guide goes beyond the definition covered in our overview of NPS, CSAT and CES. It shows the exact calculation, how to run the survey well, how to read the margin of error, how to close the loop with detractors, what to be careful about when comparing with benchmarks and how to connect NPS to the behaviour that pays the bills.
What is net promoter score?
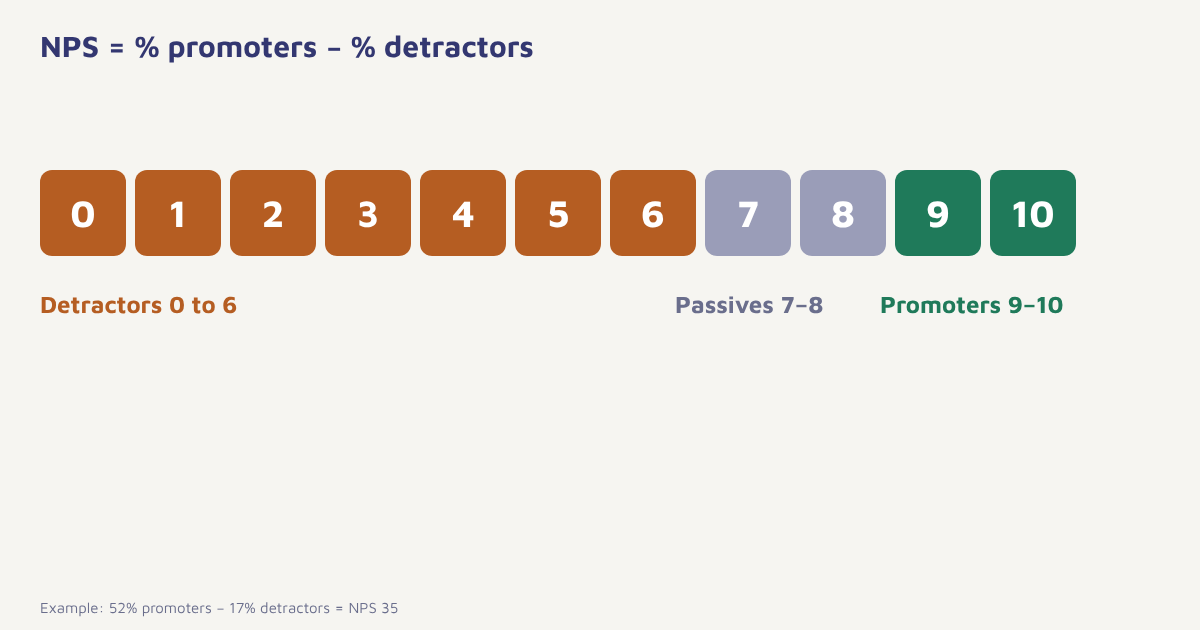
Net promoter score comes from a single survey question: “How likely are you to recommend us to a friend or colleague?”, answered on a scale from 0 (not at all likely) to 10 (extremely likely). Respondents fall into three groups.
| Score | Group | Meaning |
|---|---|---|
| 9 to 10 | Promoters | Loyal fans who tend to recommend and repurchase |
| 7 to 8 | Passives | Satisfied but unenthusiastic, open to competitors |
| 0 to 6 | Detractors | Unhappy customers who may spread negative word of mouth |
The NPS formula
Formula. NPS = % promoters − % detractors. The result ranges from −100 to +100 and is written as a whole number, not a percentage.
Take 1,000 responses: 520 promoters, 310 passives and 170 detractors. Promoters are 52 percent and detractors 17 percent, so NPS = 52 − 17 = 35. Passives affect the score only by diluting the other two groups.
-- NPS from a survey_responses table (score 0-10)
SELECT
  ROUND(100.0 * SUM(score >= 9) / COUNT(*)
      - 100.0 * SUM(score <= 6) / COUNT(*), 0) AS nps,
  COUNT(*) AS responses
FROM survey_responses
WHERE answered_at >= '2026-07-01' AND answered_at < '2026-10-01';
The query is an illustration; adjust table and column names to your schema.
How reliable is the number?
NPS is an estimate from a sample, so it has a margin of error. With the 1,000 responses above, a standard calculation gives a 95 percent margin of roughly plus or minus 4.7 points. That means a rise from 35 to 38 is within the noise, while a rise from 35 to 45 is probably real. With only 100 responses, the margin is about three times wider, so small shifts tell you nothing. Report the number of responses beside the score, and avoid celebrating movements smaller than the margin. For the underlying idea, see the article on margin of error.
Running the survey well
- Ask at a meaningful moment. Relationship NPS goes out on a regular cycle, for example every six months. Transactional NPS follows an event such as delivery or a support chat. Keep them separate.
- Keep the question unchanged. Altering the wording or scale breaks comparisons over time.
- Add one open question. “What is the main reason for your score?” The comments are worth more than the number.
- Sample fairly. Do not survey only your happiest customers or only recent buyers.
- Use the right channel. Email, WhatsApp, in-app or SMS, within consent. See which channel to use.
- Limit frequency. Do not ask the same person more than once or twice a year.
- Record who answered. Link scores to the customer profile, so you can analyse by segment.
Close the loop
A score without a follow-up is a missed opportunity. Detractors with a clear complaint should hear from a person within a day or two, passives can be asked what would make them more enthusiastic and promoters can be invited to review or refer. This is the practice described in our guide to the customer feedback loop. In Flowfox, a survey answer is an event on the profile, so a score of 6 or below can place the customer in a segment, alert your support team and pause promotional messages while the issue is handled, using a journey built in the segment builder.
| Group | Suggested follow-up |
|---|---|
| Promoters | Thank them, invite a review, offer a referral. See referral programs |
| Passives | Ask what is missing, share useful tips, check usage |
| Detractors | Personal outreach, fix the root cause, follow up later |
Benchmarks and comparisons
Published NPS averages by industry circulate widely, but they should be treated carefully. Survey timing, wording, sample, country and culture all affect scores, and cultures differ in how freely people use the top and bottom of a scale. A fair comparison is with your own history using the same method. If you compare with competitors, use the same questions and sampling. A score of 35 might be strong in one sector and ordinary in another, and the figures in this article are illustrative.
Limits of NPS
- It measures intent, not behaviour. People who say they would recommend may never do so.
- It hides detail. Two very different distributions can give the same score.
- It is not a diagnosis. The comments explain why.
- Scale quirks. A move from 6 to 7 shifts someone from detractor to passive, even though the experience barely changed.
- Gaming risk. If staff are rewarded on the score, they may coach customers to give high ones.
Pair NPS with measures of behaviour such as retention, repeat purchase rate and referrals, and with other survey types in the app survey guide. Over time you can test whether higher scores actually predict better retention for your customers, which is the most convincing way to show why the survey matters.
A worked example
A meal-kit service surveys 800 customers each quarter. Q1 gives an NPS of 28 and Q2 gives 36. The team checks the margin of error, about 5 points with that sample, and treats the rise as probably real. Reading the comments, they find that detractors mostly mention late deliveries in two cities, while promoters praise recipe variety. They set up an alert for any score of 6 or below, route delivery complaints to the logistics team and invite promoters to a referral programme. In Q3 the score reaches 41, and the repeat order rate among former detractors who received a personal follow-up is higher than among those who did not. The service and its figures are invented, but the sequence of survey, analysis, action and re-measurement is the point.
Using NPS across languages and channels
If you serve customers in more than one language or region, take care with the survey itself. The phrase “recommend to a friend or colleague” may feel natural in English but awkward when translated, and customers in different cultures use the scale differently, with some rarely giving a 10 and others rarely giving anything under 7. Translate the question carefully, test it with a few native speakers and compare scores within a language group before comparing across groups. See the general discussion of response bias for the kinds of distortion to expect.
The channel also changes who answers. A WhatsApp or SMS survey tends to reach people who are active on that channel, while an email survey reaches those who read email. In-app surveys reach only active users, which can flatter the score, because people who have already left cannot answer. If you can, send the same question through more than one channel to a random sample and compare. Send surveys only to people who have given consent for that channel, keep them short and make it easy to skip. Our guide to the DPDP Act for marketers covers notice and consent, and the guide to app survey questions offers wording for in-app prompts.
A last practical point: store the raw 0 to 10 score and the comment on the customer profile rather than only the category or the aggregate. With the raw data you can recompute the score by segment, region or cohort, test new thresholds and link scores to later behaviour. Publish the method (question, scale, timing, sample and response count) alongside the number, so that anyone reading it knows what it represents. Reference material on the original idea can be found at customer satisfaction as a starting point for the wider field.
Common mistakes
- Reporting a number with no response count. The margin of error matters.
- Ignoring the comments. That is where the learning is.
- Changing the question. You lose the trend.
- Surveying too often. Fatigue lowers response and goodwill.
- Using NPS as a target for staff pay. It invites gaming.
The score tells you how you are doing. The comments tell you what to do.
Turn survey answers into action. Segment by score, alert your team and follow up automatically.
Read next: customer health score, voice of the customer and the blog.
Frequently asked questions
How do you calculate net promoter score?
Subtract the percentage of detractors (scores 0 to 6) from the percentage of promoters (scores 9 to 10). Passives (7 and 8) are counted in the total but not in the subtraction.
What is a good NPS?
It depends on industry, country and survey method. Compare with your own history using the same method, and treat published averages as rough context only.
How many responses do I need for NPS?
More responses reduce the margin of error. With about 100 responses the margin is wide, and with around 1,000 it is roughly plus or minus 4 to 5 points.
What is the difference between relationship NPS and transactional NPS?
Relationship NPS measures overall loyalty on a regular cycle. Transactional NPS measures a specific interaction such as delivery or support right after it happens.
How often should I send an NPS survey?
Relationship surveys are usually sent once or twice a year per customer. Transactional ones follow events but should not repeat to the same person too often.
What should I do with detractors?
Contact them promptly, understand the cause, fix what you can and follow up later. Pause promotional messages while the issue is open.
Does NPS predict revenue?
Not automatically. Test whether scores predict retention, repeat purchase or referrals for your own customers before relying on it.