A customer rarely cancels without warning. Logins thin out, support tickets pile up, invoices go unpaid and emails stop being opened. A customer health score turns those scattered signals into one number or colour per customer, so your team can see who needs attention before the renewal date, not after the cancellation. This guide explains what a health score is, how it differs from churn prediction and NPS, which signals to include, how to weight them, a simple way to build and test one, how to act on the result and the mistakes that make scores misleading.
What is a customer health score?
A customer health score is a composite indicator, often 0 to 100 or red, amber and green, that summarises how likely a customer is to stay, grow or leave based on their behaviour and relationship with you. The practice is common in software and subscription businesses, where it supports customer success teams, but the idea works for ecommerce, education and finance as well. It is built from signals you already collect, combined by rules that reflect what you have learned about your own customers.
Health score vs related measures
| Measure | What it answers | Typical use |
|---|---|---|
| Health score | How is this customer doing now? | Daily prioritisation of outreach |
| Churn prediction | What is the probability this customer leaves in the next period? | Statistical model, often machine-learned |
| NPS | How do they say they feel? | Survey-based sentiment |
| RFM | How recently, often and how much do they buy? | Retail and ecommerce segmentation |
| Lifetime value | How much will they be worth? | Investment and prioritisation |
The health score is the simplest of these and the easiest to explain to a colleague, which is its main strength. A statistical model may predict churn better, but a transparent score that everyone understands is more likely to be used.
Signals to include
| Category | Example signals | Direction |
|---|---|---|
| Usage | Logins per week, key features used, orders per month | More is better |
| Engagement | Email clicks, push taps, replies, event attendance | More is better |
| Support | Open tickets, repeated complaints, time to resolve | Fewer issues is better |
| Payments | Failed payments, late invoices, downgrades | Fewer problems is better |
| Sentiment | NPS or CSAT answers, review ratings | Higher is better |
| Relationship | Number of users or contacts, executive sponsor, tenure | Depends on the business |
Start with signals that you trust and that differ across customers. If everyone has a perfect login record, that signal does not help. If a signal is missing for half your customers, handle it explicitly rather than counting it as zero.
How to build a simple health score
- Define what “healthy” means. Retained and growing over the next 6 or 12 months, for example.
- Look at past customers. Compare those who stayed with those who left. Which behaviours differed in the months before?
- Pick five to eight signals. A mix of usage, engagement, support, payment and sentiment.
- Convert each to 0 to 100. For example, logins per week mapped to bands, with the top band worth 100.
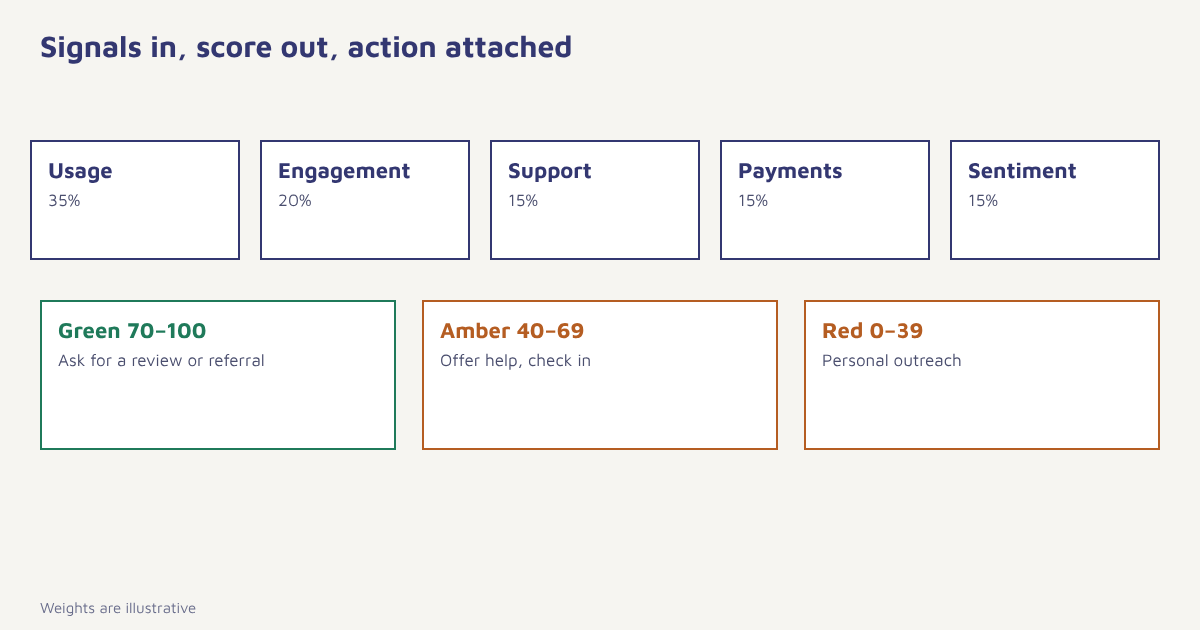
- Assign weights. Give more weight to signals that best separated stayers from leavers. Weights should add up to 100 percent.
- Set bands. For example 0 to 39 red, 40 to 69 amber, 70 to 100 green.
- Test against history. Check whether red customers left more often than green ones. Adjust.
- Attach actions to each band. A score without a playbook is decoration.
Health = 0.35 * usage
       + 0.20 * engagement
       + 0.15 * support
       + 0.15 * payments
       + 0.15 * sentiment

Bands: 0-39 red | 40-69 amber | 70-100 green
(Weights are illustrative, not recommendations)
A worked example
A project-management SaaS company with 2,000 accounts builds a first score. Looking at accounts that cancelled last year, the team sees three patterns in the two months before cancellation: weekly active users fell by more than half, the main admin stopped logging in and two or more support tickets were opened in a month. They weight usage at 40 percent, admin activity at 20, support at 15, payments at 15 and NPS at 10. When they test it on last year’s data, 62 percent of cancelled accounts were amber or red three months before cancelling, against 18 percent of retained accounts. That is useful but far from perfect, so they treat the score as a prompt for human attention, not a verdict. The company and figures are invented to show the method.
Act on the score
| Band | Action | Channel |
|---|---|---|
| Green | Ask for a review or referral, suggest advanced features | Email, in-app |
| Amber | Offer help, share a relevant tip, check in with a short message | Email, WhatsApp within consent, in-app |
| Red | Personal outreach from a person, review blockers, offer a call | Phone, WhatsApp, email |
In Flowfox, a score can be stored as a profile attribute and used in the segment builder. A journey can then send a tip when someone slips from green to amber, alert an account owner when they turn red and stop promotional messages while a problem is open. The data model page explains how events and attributes are stored, and our churn use case shows a full flow. Related reading includes reducing SaaS churn and customer engagement.
Pitfalls
- Too many signals. A score that mixes thirty inputs is impossible to explain or trust.
- Weights from opinion only. Check them against real outcomes.
- One score for every customer type. A small account and an enterprise account behave differently. Build separate scores where needed.
- Stale data. Update at least weekly for active customers.
- Ignoring context. A seasonal business will look unhealthy in its quiet months. Compare against the customer’s own pattern.
- Treating the score as truth. It is a guide that should be reviewed as you learn.
For background on the wider discipline, see the overview of customer relationship management. For a statistical alternative, read about logistic regression, a common method used to estimate the probability of an outcome such as churn.
Different customers, different scores
One of the quickest ways to make a health score misleading is to apply the same formula to every customer. A small account that logs in twice a month may be perfectly healthy, while an enterprise account with the same activity is in trouble. Group customers by size, plan, industry or lifecycle stage and compare each customer with the norm for its group, not with the whole base. A new customer in the first 30 days has no history, so score onboarding progress instead: has the key setup been completed and has the first valuable result been achieved? Our guides to customer onboarding and SaaS onboarding emails explain what to measure at that stage.
For ecommerce and other non-subscription businesses, the logic changes. There is no renewal date, so health is about the likelihood of another purchase. Use the customer’s own buying rhythm: a person who normally orders every 30 days and has not ordered in 75 is at risk, while someone who orders yearly is not. Combine that with email engagement, returns and support contacts. If you prefer a standard framework, RFM analysis is a simple and well-tested starting point, and a health score can be built on top of it.
Keep the model honest by reviewing it quarterly. List the customers who churned while green and those who stayed while red, and ask what the score missed. Often a missing signal, such as a change in the main contact or a competitor’s promotion, explains the miss. Add it if you can measure it, or note it as a human override. Many teams allow an account owner to mark a customer as at risk regardless of the score, with a short reason, because people notice things that data does not. Over time those overrides become a source of new signals and a check on the model.
Also remember communication limits. A red score may tempt you to send more messages, but flooding a struggling customer with promotions can speed their exit. Prefer fewer, more helpful touches and give people an easy way to ask for help or opt out. Consent and preferences apply to health-score outreach just as they do to marketing campaigns.
Common mistakes
- Building it and never testing it. Compare scores with real outcomes.
- No owner. Someone must act on red accounts.
- Hiding the method. Teams trust what they understand.
- Overreacting to a single drop. Look at trends over weeks.
A health score is a smoke alarm. Its value is in who runs when it sounds.
Spot unhappy customers before they leave. Store scores on the profile and trigger the right follow-up automatically.
Read next: retention strategies, the customer 360 view and the blog.
Frequently asked questions
What is a customer health score?
A customer health score is a composite indicator, such as a number from 0 to 100 or a red, amber and green rating, that summarises how likely a customer is to stay, grow or leave.
What signals go into a health score?
Common signals include product usage, engagement with messages, support tickets, payment issues, survey sentiment and relationship factors such as tenure or number of users.
How do I weight the signals?
Compare past customers who stayed with those who left, give more weight to signals that best separated them, make weights add up to 100 percent and test the result on history.
What is the difference between a health score and churn prediction?
A health score is a transparent, rule-based summary of current customer condition. Churn prediction is a statistical estimate of the probability a customer leaves in a given period.
How often should I update health scores?
At least weekly for active customers, and daily if your signals change quickly and you have a team that acts on them.
Can ecommerce businesses use health scores?
Yes. Signals such as purchase recency and frequency, email engagement, returns and support contacts can be combined into a score, or you can use RFM analysis.
How accurate is a health score?
It is a guide, not a verdict. Test it against past outcomes, expect some wrong calls and use it to prioritise human attention.