
Measuring churn tells you how many customers you lost. Predicting churn tells you which customers are about to go, while there is still time to do something about it. The difference is large: one is a report, the other is a work list. This guide explains what churn prediction is, how it differs from reporting a churn rate, the signals that usually come before a customer leaves, three ways to build a prediction (from simple rules to a statistical model), how to turn scores into action and how to check whether your predictions are any good.
What is churn prediction?
Churn prediction estimates, for each customer, how likely they are to stop buying or cancel within a set window, such as the next 30 or 90 days. It builds on the idea of churn rate, but works at the level of the individual instead of the whole base. If you want the definition and formula for the rate itself, read our guide to customer churn rate; this article starts where that one ends, with the question of what to do before the number moves.
A prediction is only worth building if it triggers a different action. A score that nobody uses is a nicer-looking dashboard. So work backwards: decide first what you will do for customers flagged as at risk (a message, a call, an offer, a product fix), then build the simplest prediction that can feed that action.
Signals that come before churn
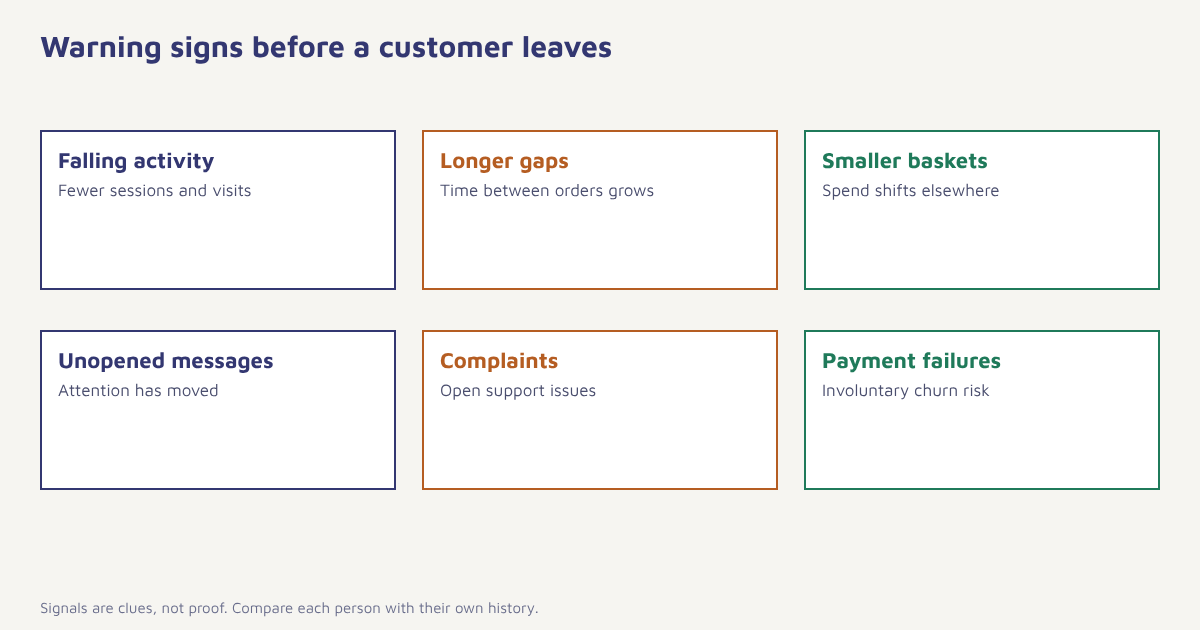
| Signal | What it may mean | Typical data |
|---|---|---|
| Falling activity | Interest is fading | Logins, sessions, site visits per week |
| Longer gaps between orders | The habit is breaking | Days since last order versus the customer’s usual gap |
| Smaller baskets | Spending is shifting elsewhere | Order value trend |
| Unopened messages | Attention has moved | Email opens and clicks, push taps (see email marketing metrics) |
| Support complaints | A bad experience is unresolved | Tickets, low survey scores (see NPS, CSAT and CES) |
| Payment failures | Involuntary churn risk | Failed renewals, expired cards |
| Feature abandonment | Value is not being found | Key feature usage dropping |
| Price or plan changes | Cost sensitivity | Downgrades, coupon-only buying |
Keep in mind that signals are clues, not proof. A customer who goes quiet in August may simply be on holiday. This is why prediction works best when it compares each person with their own history and with similar customers, as RFM analysis and cohort analysis do.
Three ways to predict churn
| Rules | Scoring | Statistical model | |
|---|---|---|---|
| Idea | If this happens, flag the customer | Add points for risk signals | Learn the pattern from past leavers |
| Skill needed | Low | Low to medium | Data analyst or data scientist |
| Time to start | Days | Weeks | Weeks to months |
| Explainable | Fully | Mostly | Depends on the model |
| Best when | Starting out, small data | You have a few clear signals | You have thousands of customers and history |
1. Rules. Start here. For an online store: no order in twice the customer’s usual gap. For an app: no login for 14 days. For a subscription: payment failed twice. Rules are easy to explain, easy to build in a segment builder and surprisingly effective.
2. Scoring. Give each signal a weight and add them up, in the same way as lead scoring works for sales. Review the weights against real outcomes every quarter.
3. Statistical or machine-learning models. A model such as logistic regression or a decision tree learns from customers who left and customers who stayed, then estimates each current customer’s probability of leaving. The general approach is covered under predictive analytics. A model needs enough history (usually many hundreds of churn events), clean data and someone to maintain it. Do not reach for it first; a good rule often captures most of the value.
-- Simple at-risk rule: customers whose gap since last order
-- is more than twice their own average gap
SELECT c.customer_id,
       DATEDIFF(CURDATE(), MAX(o.ordered_at)) AS days_since_last,
       AVG(g.gap_days) AS usual_gap
FROM customers c
JOIN orders o ON o.customer_id = c.customer_id
JOIN order_gaps g ON g.customer_id = c.customer_id
GROUP BY c.customer_id
HAVING days_since_last > 2 * usual_gap;
The query is a sketch. Table and column names differ in your database, and you would normally compute the gaps in a separate step.
How to build your first churn prediction
- Define churn for your business. A subscription cancelled? No order in 180 days? No app open in 30? Write it down and keep it fixed.
- Choose the prediction window. How far ahead do you need warning? 30 days is common for apps, 90 for retail.
- Look back at people who left. What did their last 60 days look like compared with customers who stayed?
- Pick three to five signals. The ones that clearly separate leavers from stayers.
- Turn them into a rule or score. Start with a rule. Add scoring or a model only if it adds value.
- Attach an action to each risk level. High risk: personal outreach. Medium: helpful message. Low: no change.
- Test against a holdout. Leave a random group untouched so that you can measure what the action changed.
In Flowfox, the events behind these signals live on one profile in the data model. You can build the at-risk group in the segment builder, run a journey that checks in by WhatsApp or email and track the outcome in analytics. The churn use case shows a complete flow.
Turn scores into action
| Risk level | Customer example | Action |
|---|---|---|
| High | High-value customer, sharp drop in use, open complaint | Personal call or email from a named person; fix the problem first |
| Medium | Regular buyer, longer gaps, ignoring emails | Helpful content, a restock reminder, a channel switch. See email vs SMS vs WhatsApp |
| Low | Slight dip, no complaints | Keep normal messages; watch |
| Payment risk | Card expiring, failed charge | Reminder to update payment details, with a simple link |
| Already lapsed | No activity beyond the window | Win-back sequence. See win-back campaigns |
Discounts are the obvious tool, but they are expensive and train customers to wait for offers. Often the better move is to solve the cause: a delivery problem, a missing feature, a confusing bill. Target discounts at customers where price is the real reason, and keep the rest for service and relevance. More options appear in our guide to customer retention strategies.
A worked example (invented)
Imagine a meal-kit service with 12,000 active subscribers. Looking at last year’s cancellations, the team notices that 70 percent of people who cancelled had skipped at least two deliveries in the previous six weeks, and many had also opened fewer than one email in four. It writes a simple rule: two skips in six weeks plus low email engagement means medium risk. About 900 subscribers match. A journey sends them a short message offering to swap in smaller portions or change delivery day, with a friendly note from the food team. A random tenth of the group gets nothing.
After eight weeks, the contacted group cancels at a lower rate than the holdout, and the team reads replies to find the most common reasons: portion size and delivery timing. The product team adds a smaller box. The numbers here are made up, but the sequence is realistic: a simple rule, a clear action, a holdout and a lesson that feeds back into the product.
Checking whether the prediction is any good
Two questions matter. Precision: of the customers you flagged, how many really left (or would have)? Recall: of all the customers who left, how many had you flagged? A rule that flags everyone has perfect recall and useless precision. Researchers use measures such as the ROC curve to compare models, but for a first project it is enough to ask whether flagged customers churn clearly more often than unflagged ones, and whether the gap is big enough to justify the effort. Re-check every quarter, because behaviour and products change.
Common mistakes
- Building a model before a rule. Start simple.
- No action attached. A score nobody uses changes nothing.
- Predicting too late. If the window is shorter than the time needed to respond, the warning is useless.
- Offering discounts to everyone. It costs margin and hides the real causes.
- Skipping the holdout. You cannot tell whether you saved anyone or they would have stayed anyway.
- Ignoring consent. Only message people on channels they agreed to, as our DPDP Act guide explains.
Churn rate is the obituary. Churn prediction is the chance to call before it is too late.
Find at-risk customers before they leave. Build the segment, trigger a journey and measure the result.
Read next: customer retention rate, app retention strategies and the blog.
Frequently asked questions
What is churn prediction?
Churn prediction estimates how likely each customer is to stop buying or cancel within a given period, so that you can act before they leave.
What is the difference between churn rate and churn prediction?
Churn rate measures how many customers you lost over a period. Churn prediction identifies which individual customers are at risk of leaving next.
Do I need machine learning to predict churn?
No. Many businesses get most of the value from simple rules, such as no order in twice the usual gap, and add models only when they have enough data and a clear need.
What data do I need to predict churn?
Purchase or usage history, engagement with messages, support interactions, payment events and the date each customer left or stayed.
How far ahead should I predict churn?
Pick a window longer than the time you need to respond. Thirty days is common for apps and subscriptions, and 90 days for retail.
How do I know if my churn prediction works?
Compare churn rates between flagged and unflagged customers, check precision and recall, and use a holdout group to measure whether your action reduced churn.
What should I do with customers who are at risk?
Match the action to the cause and value: fix problems for high-value customers, send helpful content to medium-risk ones and use discounts sparingly.