
The most common reason A/B tests mislead is not a bad idea or a bad tool. It is a sample that is too small. A test stopped after a few hundred visitors can show a 30 percent “win” that vanishes when rolled out. Choosing the sample size before you start is the cheapest way to make test results trustworthy. This guide explains the inputs that decide sample size, gives a formula you can check yourself, shows worked calculations with real numbers, offers a quick rule of thumb, explains what to do when your traffic is too low and lists the mistakes that quietly invalidate tests. It builds on our overview of A/B testing.
Why sample size matters
When you compare two versions, the difference you see is partly real and partly random. Small samples are noisy, so chance alone can produce a gap that looks meaningful. A larger sample averages out the noise. The relevant ideas are statistical significance, which describes how unlikely a result would be if there were no real difference, and statistical power, which is the chance of detecting a real difference when one exists. Sample size links the two: too few visitors and you will either miss real improvements or be fooled by random ones.
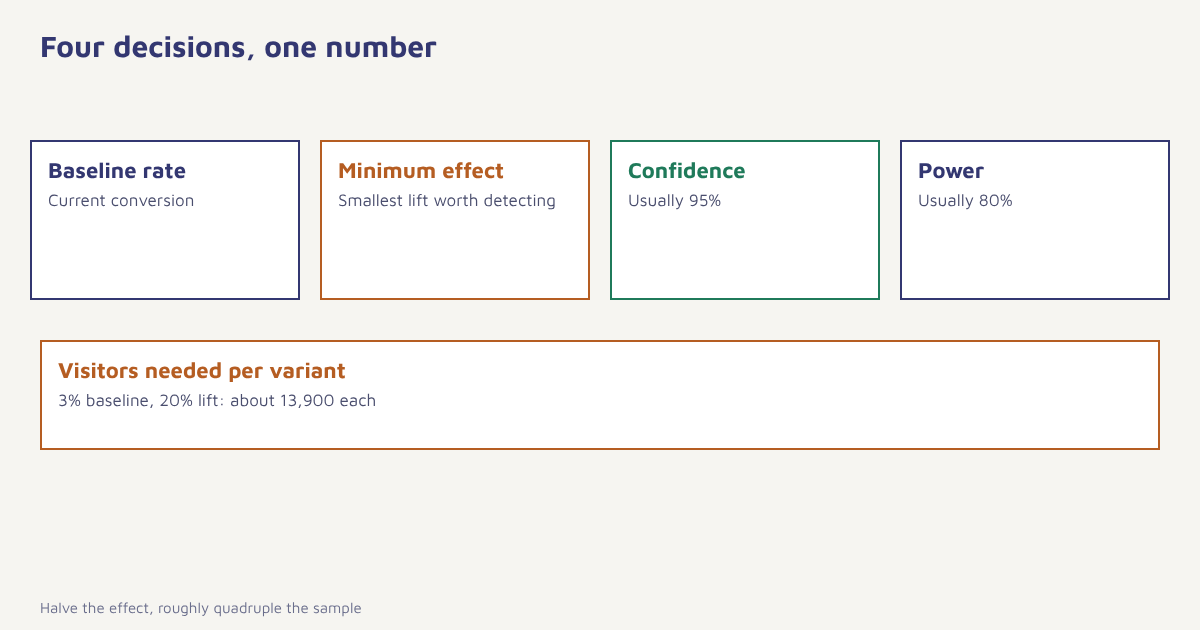
The four inputs
| Input | What it means | Typical choice |
|---|---|---|
| Baseline rate | Current conversion rate of the control | Taken from your own data |
| Minimum detectable effect (MDE) | Smallest improvement worth detecting | Often a 10 to 20 percent relative lift, depending on business value |
| Confidence level | How sure you want to be of avoiding a false win | 95 percent (significance level 0.05) |
| Power | Chance of catching a real effect of at least the MDE | 80 percent |
Two things surprise people. First, the smaller the effect you want to detect, the more visitors you need, and the relationship is steep: halving the effect roughly quadruples the sample. Second, low baseline rates need more traffic than high ones for the same relative lift, because rare events are noisy.
The formula
Sample size per variant (two-sided test of two proportions). n = ( Zα/2 × √(2 p̄(1 − p̄)) + Zβ × √(p1(1 − p1) + p2(1 − p2)) )2 ÷ (p2 − p1)2, where p1 is the baseline rate, p2 is the rate you hope to reach and p̄ is their average. For 95 percent confidence Zα/2 is 1.96, and for 80 percent power Zβ is 0.84.
from math import sqrt
from statistics import NormalDist

def sample_size(p1, p2, alpha=0.05, power=0.80):
    z = NormalDist()
    za = z.inv_cdf(1 - alpha / 2)
    zb = z.inv_cdf(power)
    pbar = (p1 + p2) / 2
    num = (za * sqrt(2 * pbar * (1 - pbar)) +
           zb * sqrt(p1 * (1 - p1) + p2 * (1 - p2))) ** 2
    return num / (p2 - p1) ** 2

print(round(sample_size(0.03, 0.036)))   # about 13,900 per variant
Worked calculations
Using the formula with 95 percent confidence and 80 percent power, the table shows visitors needed in each variant. The values were calculated with the code above.
| Baseline rate | Target rate | Relative lift | Visitors per variant | Total for two variants |
|---|---|---|---|---|
| 2.0% | 2.5% | 25% | 13,809 | 27,618 |
| 3.0% | 3.6% | 20% | 13,914 | 27,828 |
| 5.0% | 6.0% | 20% | 8,158 | 16,316 |
| 10.0% | 12.0% | 20% | 3,841 | 7,682 |
| 20.0% | 22.0% | 10% | 6,509 | 13,018 |
Look at the first two rows: a 20 percent lift on a 3 percent baseline needs nearly 14,000 visitors per variant, over 27,000 in total. If your page gets 2,000 visitors a week, that test would take about 14 weeks, which is too long for most businesses. This is why choosing the right MDE and the right page to test matters as much as the idea itself.
A quick rule of thumb
A well-known shortcut for 95 percent confidence and 80 percent power is n ≈ 16 × p(1 − p) ÷ d2, where p is the baseline rate and d is the absolute difference you want to detect. For a 3 percent baseline and a 0.6 point lift (d = 0.006), it gives about 12,900 per variant. The exact formula gives about 13,900, so the shortcut slightly underestimates. Use it for a quick feasibility check, then use the full calculation or a calculator before launching.
How to plan a test
- Pick the metric. One primary metric, such as purchases per visitor, chosen before the test.
- Get the baseline. Use at least several weeks of recent data for the same page and audience.
- Choose the MDE. What lift would justify the change? Smaller than that is not worth detecting.
- Calculate the sample. Per variant, for your confidence and power.
- Convert to duration. Divide the total sample by weekly eligible traffic. Round up to whole weeks.
- Decide if it is feasible. If it takes months, test a bolder change, test a higher-traffic page or use a different method.
- Commit to the plan. Run the full duration and do not stop early on a good-looking result.
Email tests follow the same logic, with the sample being recipients and the metric usually clicks or conversions. Our guide to the best time to send email shows a test in practice, and the click-through rate guide explains the metric. In Flowfox, you can split a campaign audience at random and compare results in analytics.
When you do not have enough traffic
- Test bigger changes. A new offer or layout can produce a large lift that small samples can detect, unlike a button colour.
- Choose a higher-rate metric. Clicks happen more often than purchases, so click tests need fewer visitors. Check that the click metric relates to the real goal.
- Test where traffic is. Put the experiment on your busiest page or largest email segment.
- Accept a larger MDE. Decide you will only act on big wins.
- Use research instead. Customer interviews, session recordings and surveys can guide decisions when numbers cannot. See conversion rate optimization.
- Roll out carefully. Make obvious improvements, such as fixing a broken form, without testing them.
Mistakes that quietly invalidate tests
| Mistake | Why it matters |
|---|---|
| Peeking and stopping early | Repeated checking inflates false positives. Fix the duration beforehand or use a method designed for sequential testing |
| Testing many variants at once | More comparisons increase the chance of a false win |
| Running for less than a full week | Weekday and weekend behaviour differ |
| Changing the test midway | Mixed data cannot be interpreted |
| Ignoring the novelty effect | Early excitement fades; look at the longer period |
| Unequal or non-random splits | Biased groups give biased results |
| Reading many metrics | One of them will look good by chance. Name one primary metric |
If you test several things at once, you may need corrections for multiple comparisons, a topic described in the article on multiple comparisons. Simple tests with one change, one primary metric and a fixed duration avoid most problems. For readers who want the mathematics behind the formula, the entry on sample size determination covers the general approach.
Putting it together
An online store has a checkout completion rate of 40 percent and 6,000 checkout visitors a week. It wants to test a shorter form, hoping for a lift to 44 percent. Plugging the numbers into the formula gives roughly 2,400 visitors per variant, so 4,800 in total. At 6,000 visitors a week, the test fits in one week, but the team rounds up to two weeks to cover two weekends. After two weeks the new form shows 43.6 percent against 40.3 percent, and the result is clear enough to roll out. The store and numbers are invented; the point is the order of work: plan the sample first, then run, then read.
A test that is too small does not just fail to find the truth. It confidently finds something else.
Split an audience and measure the result. Run tests on campaigns and read the outcome by segment.
Read next: conversion rate optimization, attribution models and the blog.
Frequently asked questions
How do I calculate sample size for an A/B test?
Use the baseline conversion rate, the smallest lift you want to detect, your confidence level (often 95 percent) and power (often 80 percent) in the two-proportion sample size formula or a calculator.
How many visitors do I need for an A/B test?
It depends on the baseline and the lift. For example, a 3 percent baseline and a 20 percent relative lift need about 13,900 visitors per variant at 95 percent confidence and 80 percent power.
What is minimum detectable effect?
The minimum detectable effect is the smallest improvement you care about detecting. Smaller effects need much larger samples.
Why should I not stop an A/B test early?
Checking results repeatedly and stopping when they look good raises the chance of a false positive. Decide the sample size and duration before starting.
How long should an A/B test run?
Divide the total sample needed by your weekly eligible traffic and round up to whole weeks, so weekday and weekend behaviour are both covered.
What can I do if I have low traffic?
Test bigger changes, use a higher-frequency metric that relates to the goal, test on your busiest pages, accept a larger minimum effect or rely on qualitative research.
What is statistical power?
Power is the probability that a test detects a real effect of at least the size you specified. Eighty percent is a common choice.