
Most marketing dashboards fail in one of two ways. They show forty numbers and nobody knows which matter, or they show one number, usually revenue, and nobody knows why it moved. Good marketing KPIs sit between those extremes: a short set of measures that tie daily work to business results and tell the team what to do next. This guide explains what a marketing KPI is, how it differs from a plain metric, which KPIs suit which goal, how to build a KPI tree, how to set targets without inventing them and which numbers to leave out.
What is a marketing KPI?
A key performance indicator is a measure chosen because it shows progress toward a specific objective. The general idea is covered under performance indicators. Every KPI is a metric, but few metrics deserve to be a KPI. Page views are a metric. “Qualified leads per month from email” is a KPI if getting qualified leads is the goal and email is a channel you are accountable for. The test is simple: if this number moved by 20 percent, would we change what we do? If not, it is a metric, not a KPI.
KPI, metric and goal: the difference
| Term | What it is | Example |
|---|---|---|
| Goal | What you want to achieve | Grow repeat revenue this year |
| KPI | The measure of progress toward the goal | Repeat purchase rate |
| Metric | Any number you can track | Emails sent, opens, sessions |
| Target | The value you aim for by a date | Raise repeat purchase rate from 22% to 26% by March |
Teams often skip the goal and go straight to measuring whatever the tools provide. That is how dashboards fill up with numbers nobody owns. Write the goal first, in one sentence.
Marketing KPIs by goal
| Goal | KPIs to consider | Where to learn more |
|---|---|---|
| Acquire customers | Leads, cost per lead, customer acquisition cost, conversion rate | Lead generation |
| Convert visitors | Conversion rate, add-to-cart rate, checkout completion | CRO guide |
| Grow order value | Average order value, items per order | Average order value |
| Retain customers | Retention rate, churn rate, repeat purchase rate | Retention rate |
| Engage subscribers | Click-through rate, active subscribers, unsubscribe rate | Click-through rate |
| Prove value | Marketing ROI, revenue per campaign, lifetime value | Marketing ROI |
| Satisfy customers | NPS, CSAT, effort score | Net promoter score |
Build a KPI tree
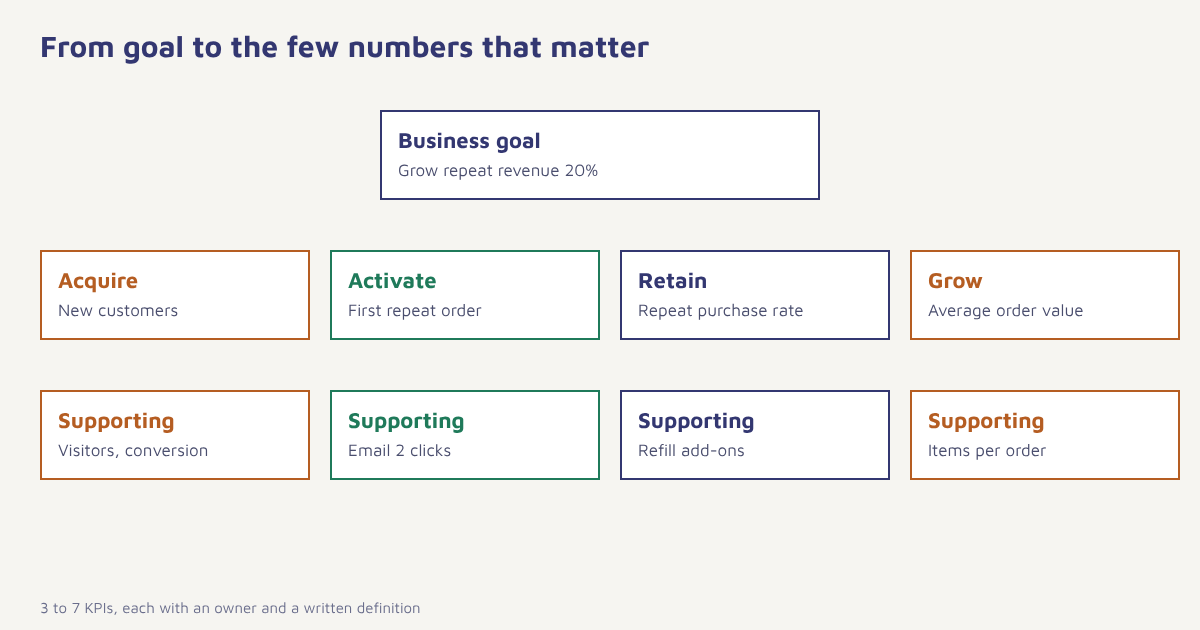
A KPI tree breaks one big outcome into the parts that multiply to produce it. Revenue, for instance, equals customers multiplied by orders per customer multiplied by average order value. Each branch can be owned by a person or team, and each leaf is something they can influence. When revenue moves, you read down the tree to see which branch moved. That turns a vague conversation (“sales are down”) into a specific one (“repeat orders per customer fell while new customers held steady”).
Revenue
├─ Customers
│   ├─ New customers      = visitors × conversion rate
│   └─ Returning customers = prior customers × retention rate
├─ Orders per customer     = repeat purchase rate × cycle length
└─ Average order value     = items per order × price per item
A tree like this also exposes trade-offs. Discounts may raise new customers and lower average order value at the same time. Looking at the tree, you can see whether the net effect is good.
Pair leading and lagging KPIs
Revenue arrives late. To act in time, pair each lagging KPI with one or two earlier signals, as explained in our guide to leading and lagging indicators. If renewals are the outcome, activation in the first week may be the signal. If repeat purchase is the outcome, the share of new customers who open the first two emails may be the signal. Review leading KPIs weekly and lagging ones monthly or quarterly.
How to choose and set your KPIs
- Write the business goal. One sentence, with a time frame.
- Sketch the tree. Break the goal into two to four drivers, then break those again.
- Pick three to seven KPIs. Choose the ones you can influence and measure reliably.
- Define each precisely. Formula, data source, time window and owner. Write it down.
- Set baselines. Record the last three to six months before you set targets.
- Set targets from the baseline. Use realistic ranges based on past movement, not borrowed industry averages.
- Review on a rhythm. Weekly for leading KPIs, monthly for lagging ones, and a yearly check that the list still fits the goal.
In Flowfox, analytics reports campaign and journey results by channel and segment, so the same event data feeds both operational reports and KPIs. Our guide to the marketing dashboard shows how to lay them out.
A worked example
Consider a skincare store whose goal is to raise yearly revenue by 20 percent without raising ad spend. The tree gives three branches: more first-time buyers, more repeat buyers and larger baskets. After reviewing six months of data, the team finds that first-time buyer volume is steady, repeat purchase rate is 18 percent and average order value is stable. The largest lever is repeat purchase, so the main KPI becomes repeat purchase rate within 120 days, with two leading signals: the share of new customers who open the second email and the share who add a refill to their next order. The target is a rise from 18 to 22 percent over two quarters, with a 10 percent holdout group to check that the programme is the cause. The brand and numbers are invented to show the method, not benchmarks.
Notice what the team did not do. It did not add every available metric, it did not borrow a target from a blog post and it did not report total email opens as a success measure. For background on how targets and measures connect, the idea of objectives and key results is a related approach to keeping goals and measures together.
Numbers to demote or drop
| Number | Problem | Better option |
|---|---|---|
| Total email opens | Distorted by privacy features and image pre-loading | Click-through rate, conversions. See open rate |
| Followers and likes | Easy to grow, weak link to revenue | Qualified traffic and sign-ups |
| Total list size | Counts people who never read | Active subscribers in the last 90 days |
| Page views | Says nothing about intent | Conversion events |
| Impressions | Reach without response | Cost per qualified action |
Be careful with targets that people can game. When a number becomes a target, behaviour bends toward it, a pattern often summarised as Goodhart’s law. Pair volume KPIs with a quality check, for example leads with the share that become meetings, so that hitting the target also helps the business.
Reporting KPIs so people use them
A KPI that lives in a spreadsheet nobody opens might as well not exist. Give each KPI a home in a short weekly report or on a single page, show the target and the previous period beside the current value, and add one sentence of interpretation. Without that sentence, readers fill the gap with their own story. A good rhythm has three layers. A weekly review looks at leading KPIs and decides small actions. A monthly review looks at lagging KPIs and asks whether the tree still reflects reality. A quarterly review asks whether the goal itself is still right. Keep the meetings short by sending the numbers in advance, and record decisions so you can later check whether they worked.
It also helps to separate KPIs you own from KPIs you influence. A content team owns publishing consistency and click-through, but only influences revenue. Holding people accountable for outcomes they cannot control encourages blame, while holding them accountable only for activities they control encourages busywork. The best arrangement is shared: one outcome KPI that several teams care about, and a few input KPIs each team owns. For more on turning KPIs into a regular view, see our guide to the marketing dashboard, and for the wider discipline of measurement, the overview of marketing metrics.
Finally, revisit the list when your business changes. A launch, a new channel or a change in pricing can make last year’s KPIs irrelevant. Retire numbers deliberately, say why, and keep a short history of what you tracked and when, so that trends remain comparable.
Common mistakes
- Too many KPIs. Focus dies at about a dozen.
- No definitions. Two people compute “conversion rate” differently and argue.
- Targets from nowhere. Use your own baseline.
- Only lagging KPIs. You learn too late.
- Never retiring a KPI. Goals change, and so should the list.
A KPI is a question you have decided to ask every week. Choose the questions carefully.
Track the numbers that move the business. See campaign, channel and segment results in one place.
Read next: growth rate formula, attribution models and the blog.
Frequently asked questions
What is a marketing KPI?
A marketing KPI is a measure chosen because it shows progress toward a specific business objective, and one that would change what the team does if it moved significantly.
What is the difference between a KPI and a metric?
A metric is any number you can track. A KPI is a metric chosen to show progress toward a goal. Every KPI is a metric but most metrics are not KPIs.
How many KPIs should a marketing team track?
Usually three to seven. More than about a dozen makes it hard to focus and to assign ownership.
What are the most common marketing KPIs?
Conversion rate, customer acquisition cost, retention or repeat purchase rate, average order value, click-through rate, marketing ROI and customer lifetime value, chosen to fit the goal.
How do I set a realistic KPI target?
Record your baseline over several months, look at how much the number normally varies, and set a target that is ambitious but within the range of past movement or planned changes.
What is a KPI tree?
A KPI tree breaks a top-level outcome such as revenue into the drivers that multiply or add up to it, so you can see which branch caused a change.
Should I use industry benchmarks as KPI targets?
Use them only as rough context. Your own baseline, audience and business model matter more than published averages.