
Open rate is the most quoted number in email marketing and, since 2021, one of the least trustworthy. It still tells you something, but only if you know how it is measured, what distorts it and what to look at beside it. This guide explains how email open rate is calculated, how the tracking works, why privacy features changed the picture, what really influences opens, how to improve them honestly and which metrics to lean on when opens stop being reliable. For the wider set of measures, see our guide to email marketing metrics.
What is email open rate?
Open rate is the percentage of delivered emails that were recorded as opened. Notice the word “recorded”. Email has no built-in open receipt, so every platform estimates opens indirectly, and the estimate can be wrong in both directions.
Formula. Open rate (%) = unique opens ÷ emails delivered × 100. Use delivered, not sent, so that bounces do not lower the figure.
If you send 10,000 emails, 9,800 are delivered and 2,450 are recorded as opened, the open rate is 25 percent (2,450 ÷ 9,800). Some tools also report total opens, which counts repeat opens by the same person. Unique opens is the better base for comparisons.
How opens are tracked
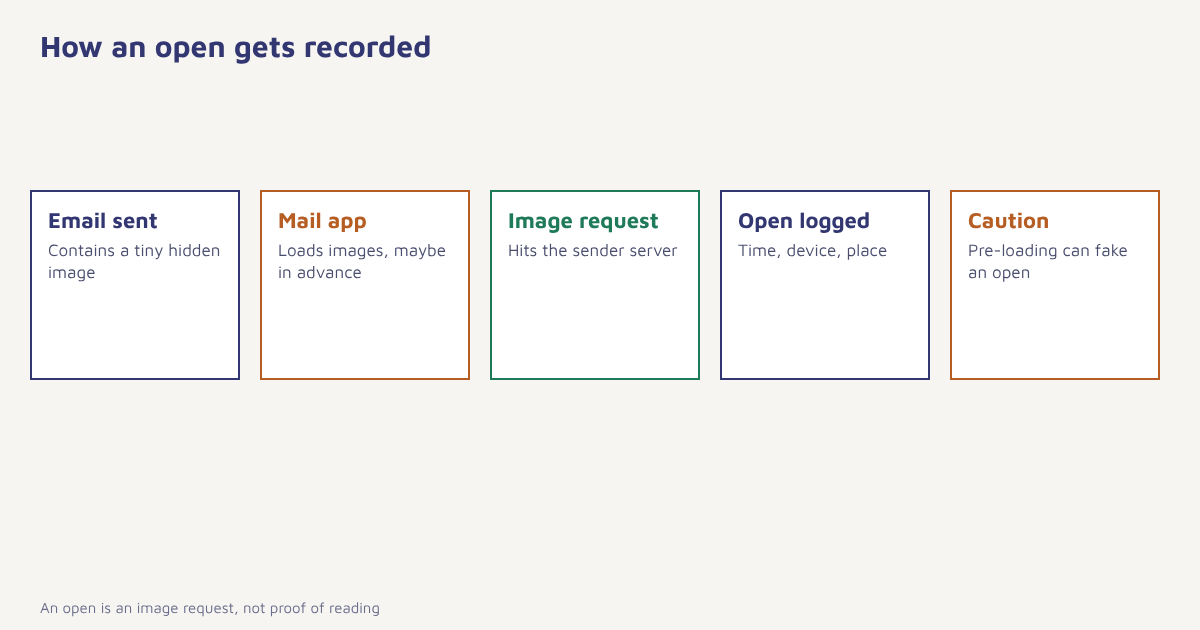
Most platforms insert a tiny, usually one-pixel image into the email, often called a tracking pixel. When the recipient’s mail app loads images, it requests that file from the sender’s server, and the server logs an open with a time, an approximate location and a device type. The wider practice is described under email tracking. The snippet below shows the idea.
<!-- Illustrative tracking pixel, normally inserted by your platform -->
<img src="https://track.example.com/o/abc123.gif"
     width="1" height="1" alt="" style="display:none">
That design has built-in blind spots. If the recipient reads the email with images blocked, no open is recorded. If the app loads images automatically in advance, an open is recorded even if the person never read the message.
Why open rates became unreliable
In recent years, several privacy features have changed what an open means. Apple introduced Mail Privacy Protection for its Mail app, which, when switched on by the user, can pre-load remote content through proxy servers, so opens may be recorded whether or not the message is read. Some other mail clients and security gateways also fetch images automatically to scan for threats. Exact behaviour differs by app, version and user settings, and it changes over time, so check the current documentation from Apple and your email platform instead of relying on a fixed percentage.
| Distortion | Effect on recorded opens | What to do |
|---|---|---|
| Apple Mail Privacy Protection (when enabled) | Opens may be inflated, and location and device data become less precise | Segment out affected opens if your platform flags them and judge by clicks |
| Security scanners that load images | Opens recorded within seconds of delivery | Ignore opens with an instant timestamp pattern |
| Images blocked by the recipient | Opens under-counted | Do not treat a missing open as proof the email was ignored |
| Plain-text emails without pixel | No opens recorded | Use click tracking instead |
| Forwarded or opened on a second device | Opens may be duplicated or missed | Use unique opens per recipient |
The practical result is that your open rate may have risen without your content improving. Treat any sudden jump with suspicion, particularly if click rate stayed flat.
What is a good open rate?
Published averages vary widely by industry, list quality, country and even the year, and they were mostly collected before and after the privacy changes, so they are not directly comparable. A figure from a blog post is a weak target. A better benchmark is your own history: compare the same type of email, to the same segment, over several months, and watch the trend instead of a single number. Our guide to email newsletters and drip campaigns explains how different email types naturally produce different open levels. Welcome emails and transactional messages tend to be opened more than promotions, for instance.
What really influences whether people open
| Factor | Why it matters | Where to read more |
|---|---|---|
| Sender name | People open mail from names they recognise | Use a consistent, human sender name |
| Subject line and preheader | They decide in a second | Email subject lines |
| Relevance | Segmented mail matches interests | Customer segmentation |
| Timing | Inbox position and habits | Best time to send email |
| Frequency | Fatigue lowers attention | Email newsletters |
| Inbox placement | Spam folder mail is rarely opened | Email deliverability |
| List health | Inactive addresses drag the average down | Email list building |
The last two deserve emphasis. A low open rate is often a deliverability problem in disguise. If mailbox providers send you to spam or the promotions tab, even the best subject line will not rescue the result. Before rewriting copy, check authentication with our SPF, DKIM and DMARC guide and look at your bounce rate.
How to improve open rate without gimmicks
- Check inbox placement first. Send test emails to several mailbox providers and see where they land. Fix authentication and list quality before changing copy.
- Clean the list. Remove hard bounces and consider a re-permission step for people inactive for 6 to 12 months.
- Use a recognisable sender. Keep the from name and address consistent, ideally a person or brand name your readers know.
- Write honest subject lines. Promise what the email delivers. Misleading lines may lift opens once and raise complaints for good.
- Segment. Send fewer, more relevant emails to groups that care. See behavioral segmentation.
- Test one variable at a time. Subject, sender name or send time, with a proper split. See A/B testing.
- Judge results on clicks and outcomes. An open that leads nowhere is not a win.
In Flowfox, the campaign tools let you test subject lines and send times, and analytics shows opens, clicks and conversions side by side so that you can see whether a lift in opens produced any extra visits or orders. The email channel page covers delivery features.
A worked example (invented)
A stationery store notices that its newsletter open rate rose from 24 to 41 percent over two months, but orders from the newsletter did not change. A look at the data shows that opens now arrive within seconds of sending for a large share of recipients, mostly on one mail app. That pattern suggests automatic image loading rather than real reading. The team stops reporting open rate as its headline figure. It tracks click-through rate, revenue per delivered email and the share of recipients who clicked at least once in 90 days. It keeps open rate as a rough check on deliverability, comparing only like with like. Within a quarter, it finds that a subject-line change which raised clicks by a modest margin was invisible in the open rate, while a more dramatic subject line that lifted opens did nothing for sales. The store and figures here are made up to show the reasoning.
Metrics to rely on when opens wobble
| Metric | What it tells you | Reliability |
|---|---|---|
| Click-through rate | Interest in the content | High, a real human action |
| Click-to-open rate | Content strength among openers | Medium, depends on opens |
| Conversion rate | Whether the email achieved its goal | High |
| Revenue per delivered email | Money value of the campaign | High |
| Unsubscribe and complaint rates | List health and relevance | High |
| Reply rate | Real conversation, useful for B2B | High |
| Active in last 90 days | Engagement across several emails | High |
You can still use open rate as a directional signal for subject-line tests when the audience mix is similar, as a deliverability warning (a sudden collapse across all providers is a red flag) and as one input for deciding who counts as inactive. For a deeper look at click rate, read our guide to email click-through rate.
Common mistakes
- Reporting opens as proof of interest. They are an estimate.
- Comparing to an industry average from years ago. The measurement changed.
- Optimising for opens only. Curiosity bait raises complaints.
- Ignoring deliverability. Spam-foldered mail looks like a content problem.
- Using opens to trigger automation. Rules such as “send a reminder if not opened” misfire for automatic opens. Prefer click-based triggers.
An open tells you a picture loaded. A click tells you a person cared.
See opens, clicks and revenue together. Test subject lines and send times, then judge them by outcomes.
Read next: sender reputation, email automation examples and the blog.
Frequently asked questions
What is email open rate?
Email open rate is the percentage of delivered emails that were recorded as opened, usually calculated as unique opens divided by delivered emails, times 100.
How is email open rate calculated?
Divide the number of unique opens by the number of delivered emails and multiply by 100. Using delivered instead of sent keeps bounces from lowering the rate.
Are email open rates still reliable?
Less than they used to be. Features that load images automatically, such as Apple Mail Privacy Protection when enabled, and security scanners can inflate opens, while blocked images can hide real ones.
What is a good email open rate?
There is no single good figure. It varies by industry, list quality and email type, so compare your own results over time for the same kind of email and segment.
How do I improve my email open rate?
Make sure emails reach the inbox, clean the list, use a recognisable sender and honest subject lines, segment, and test one change at a time.
What should I measure instead of open rate?
Click-through rate, conversion rate, revenue per delivered email, unsubscribe and complaint rates, and engagement over a 90-day window are more dependable.
Why did my open rate suddenly jump?
A jump with flat clicks often points to automatic image loading by mail apps or security tools rather than real interest. Check click rate and timing patterns before celebrating.